
AAPL

 <% (signals.list.current.rate).substr(0,7) %>
 <% signal.analyst %>

Last Updated: Jun 16, 2026 07:41:50 AM (GMT)
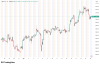
AAPL: Currently, the market price is 295.69, reflecting a decrease of -0.34% from the previous price.
Support and Resistance Levels The support levels are 295.54667, 295.34333, and 295.15667. Meanwhile, the resistance levels are at 295.93667, 296.12333, and 296.32667. The pivot point is set at 295.73333.
Indicators The RSI is 53.24, indicating a neutral trend. ATR is at 0.86983, showing less volatility. ADX stands at 22.06942, suggesting a weak trend. The Parabolic SAR is at 293.24364, indicating a potential bearish signal. The MACD shows a value of 0.66457, with a signal of 0.80177 and a negative hist value of -0.1372, pointing towards uncertainty.
Market Sentiment With the price below the pivot point of 295.73333 and indicators uncertain, a bearish scenario is likely.
AAPL Signals & Technical Analysis
Market Sentiment
Trend Indicators
Oscillators
Moving Averages
Pivot
About (AAPL) Apple Inc.
Company Background
Apple Inc. (NASDAQ: AAPL) is a globally recognized technology company headquartered in Cupertino, California. Founded in 1976 by Steve Jobs, Steve Wozniak, and Ronald Wayne, Apple has revolutionized the consumer electronics industry with its innovative products, including the iPhone, iPad, Mac computers, Apple Watch, and Apple TV. The company has built a robust ecosystem that seamlessly integrates hardware, software, and services, enhancing the user experience and brand loyalty. Over the years, Apple has expanded its offerings to include various services such as Apple Music, iCloud, and the App Store, solidifying its status as a leader in both hardware and software solutions.Market Position
Apple Inc. holds a dominant position in the global technology market, consistently ranking among the top companies by market capitalization. As of 2023, Apple is one of the most valuable publicly traded companies in the world, known for its strong brand equity and loyal customer base. The company's innovative approach to design and functionality has allowed it to maintain a competitive edge over rivals like Samsung, Microsoft, and Google. Apple continues to expand its market reach through strategic partnerships and international expansion, focusing on emerging markets that present significant growth opportunities.Key Financial Highlights
Apple's financial performance reflects its strong market position and operational efficiency. For the fiscal year 2022, the company reported revenues of $394.3 billion, marking a year-over-year growth driven by robust demand for its flagship products, particularly the iPhone and Mac lines. With a consistently high gross margin, Apple maintains a healthy profit trajectory, bolstered by its diverse revenue streams from services and wearables. The company's commitment to returning value to shareholders is evident through regular dividend payments and share buyback programs. Furthermore, Apple is positioned to invest in research and development, ensuring sustained innovation and long-term growth.Industry Highlights
The technology sector continues to evolve rapidly, with artificial intelligence, augmented reality, and increased connectivity shaping future trends. Apple remains at the forefront of these advancements, leveraging its extensive resources to explore new technologies and maintain its leadership role. As a pioneer in sustainability initiatives, Apple is also focusing on reducing its environmental impact, aiming for carbon neutrality across its supply chain by 2030. This commitment not only enhances its brand reputation but also aligns with the growing consumer demand for environmentally responsible practices.AAPL - Frequently Asked Questions
Apple stock (AAPL) enjoyed a significant stride in revenues after introducing Apple Silicon and releasing the final products of the transition in 2023. The stock as well as the trading pair is a good investment given the company’s advancing technology in processor manufacturing and exploring a high-growth market in VR/AR.
Apple experienced a tough 2022 but the company’s strength was revealed after its products recorded remarkable sales. This was despite shipments from other personal computer manufacturers dropped by 15%. Apple products on the other hand surged by 40.2% in the third quarter of 2022. The company’s current investment in its manufacturing process and entry into other high-growth markets means well for the company’s stock. It is evident that Apple (AAPL) stocks have a bullish long-term outlook.
Apple announced facing strong headwinds due to the dollar growing strong and posing supply chain challenges for its latest iPhone models. However, Apple (AAPL) is not the only stock facing the impacts of a strong dollar. The same is happening across Microsoft, which we have seen reportedly slice its revenue and profits.
Market sentiments, new product releases, Apple and Mac services and iPhone sales are some of the factors that drive the price of AAPL. Judging from the above factors and how positive they are at the moment, it’s easy to predict a bullish medium-term outlook.
How to Buy or Trade Apple Inc. Stock (AAPL) with AvaTrade
Trading or investing in Apple Inc. stock through AvaTrade starts with opening a verified trading account. After registration, complete the KYC verification process by submitting your ID and proof of address, then fund your account using a supported payment method such as bank transfer, debit card, or e-wallet. Once your funds reflect, log into the AvaTrade platform or mobile app and search for the ticker symbol AAPL, which represents Apple Inc.. Before placing a trade, review the live Apple Inc. share price, market trend, spread, leverage options, and recent market news that could impact the stock price.
The next step is deciding whether you want to buy or sell Apple Inc. stock. Traders expecting the price to rise typically open a Buy position, while traders expecting weakness in the sector may open a Sell position using CFDs. Enter your preferred trade size, then apply risk management tools such as a stop-loss to limit downside exposure and a take-profit order to secure profits automatically. After confirming the trade, monitor key drivers including Apple Inc. earnings reports, product or service announcements, business segment performance, revenue growth, and overall stock market sentiment. Many traders also use technical indicators such as moving averages, RSI, and support/resistance levels available on the AvaTrade platform to improve timing and trading decisions.
Related Stocks


Sidebar rates
- <% signal.pair %>
 <% signals.active.Current.rate.substr(0,7) %>
