USD/JPY, Long or Short?
Looking at the hourly USD/JPY chart, you can see there is an opportunity for a buy trade right now in this forex pair. The hourly chart is
Looking at the hourly USD/JPY chart, you can see there is an opportunity for a buy trade right now in this forex pair. The hourly chart is oversold since stochastic is oversold, the trend is up and the 100 SMA (green) has been providing support previously, which is likely to do the same again.
Well, I was about to, but then I switched to the H4 chart and saw a contradicting picture. The H4 chart was overbought a while ago, and now it is headed lower.
 The 50 SMA is a much safer place to go long from.
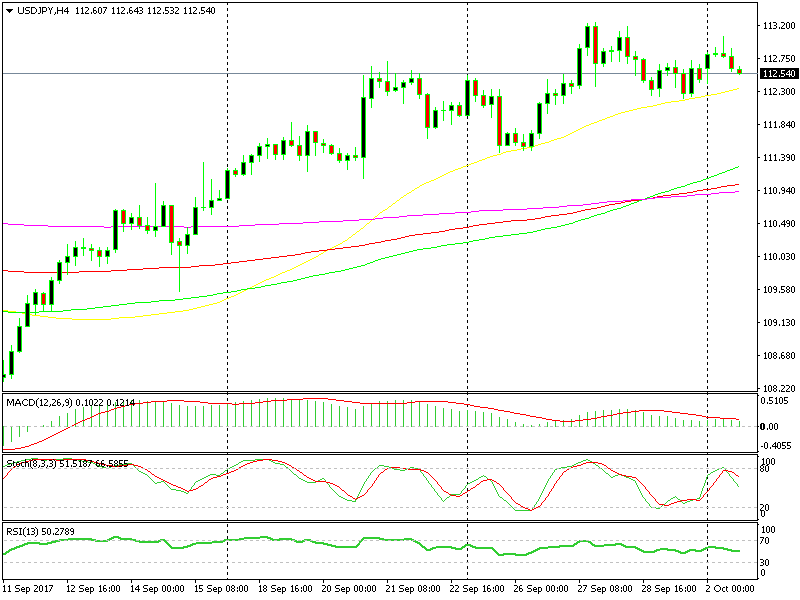
Besides that, the previous two candlesticks closed as upside down pins, which are reversing signals after an uptrend. The price has already turned lower, and it is still sliding, so I think I will wait until we reach the 50 SMA (yellow).
This moving average provided support and held the uptrend in place last week. By the time we get there, the price will likely be oversold as well. Almost forgot, the U.S. ISM manufacturing data is due soon, so we’ll sit that out, too before going long on USD/JPY.
- Check out our free forex signals
- Follow the top economic events on FX Leaders economic calendar
- Trade better, discover more Forex Trading Strategies
- Open a FREE Trading Account
- Read our latest reviews on: Avatrade, Exness, HFM and XM
Related Articles


Sidebar rates
Related Posts
