A Bullish Chart Setup Formed in EUR/CHF and We Went Long
EUR/CHF has been trading in a range for more than a week, but yesterday it broke the range to the upside. The move higher stretched higher
EUR/CHF has been trading in a range for more than a week, but yesterday it broke the range to the upside. The move higher stretched higher this morning, but the price reversed and this forex pair went through a retracing period.
The price has slipped lower in the last few hours. But right now, the decline has stopped and the setup on the H1 timeframe chart looks bullish.
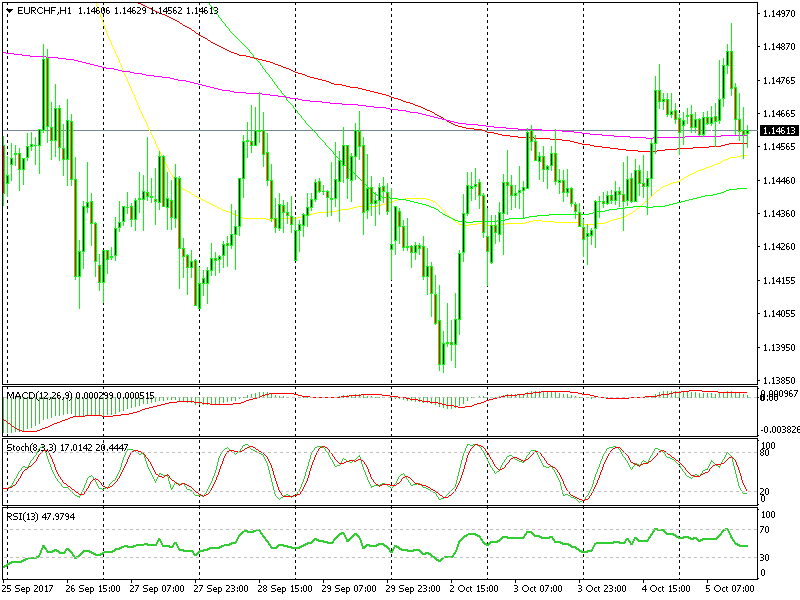 The last doji candlestick is another bullish signal
Right now the price is at a resistance area which has been the top of the range in the last seven days. Resistance usually turns into support, so that’s what this level is doing at the moment.
Besides, the stochastic indicator has reached oversold levels, which means that the retrace lower is over.
But there’s more technical indicators that point up. The 50, 100 and 200 SMAs are providing solid support for this pair after providing solid resistance for more than a week. So, we decided to go long and this forex signal looks to be on the right track.
- Check out our free forex signals
- Follow the top economic events on FX Leaders economic calendar
- Trade better, discover more Forex Trading Strategies
- Open a FREE Trading Account
- Read our latest reviews on: Avatrade, Exness, HFM and XM
Related Articles


Sidebar rates
Related Posts
