Long Term USD/CAD Analysis – Contradicting Signals in Different Charts. Which Side Are You Taking?
Yesterday I was looking at the H4 USD/CAD chart of the past several weeks. This pair has been in an uptrend for weeks, so it seemed like th
Yesterday I was looking at the H4 USD/CAD chart of the past several weeks. This pair has been in an uptrend for weeks, so it seemed like the bigger downtrend of the past two years might have been over.
I switched to the monthly USD/CAD chart to see the bigger picture. The monthly chart is showing the same thing. In the last decade this pair has been in an uptrend, but in the last two years, USD/CAD has slipped lower in a retrace.
 We’re just below the big resistance level on the daily chart.
Last month, the price briefly pierced the 50 SMA (yellow) but the monthly candlestick closed back above it, which means that this moving average has turned into support. It has provided resistance back in 2011, and now it is turning into support.
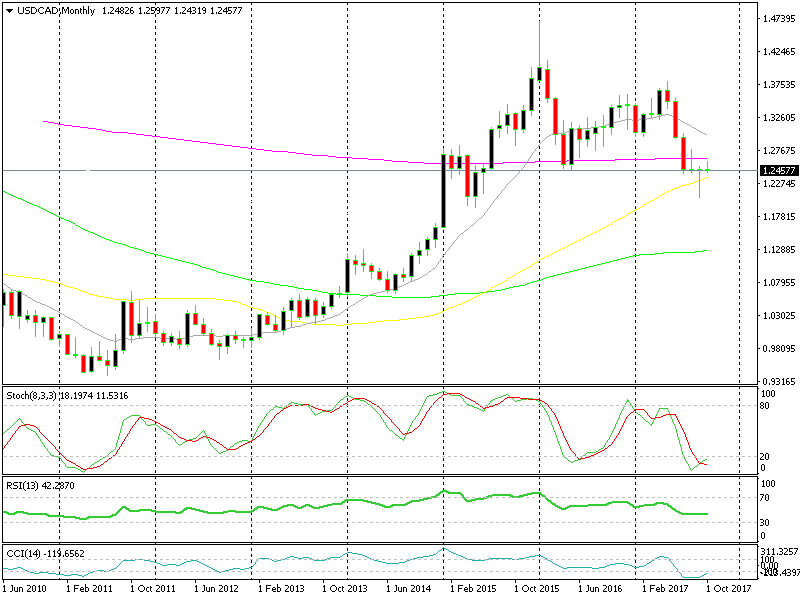
The monthly chart is strongly bullish though.
Also, last month’s candlestick formed a pin which is a reversing signal. So, the two-year retrace must be over, right?
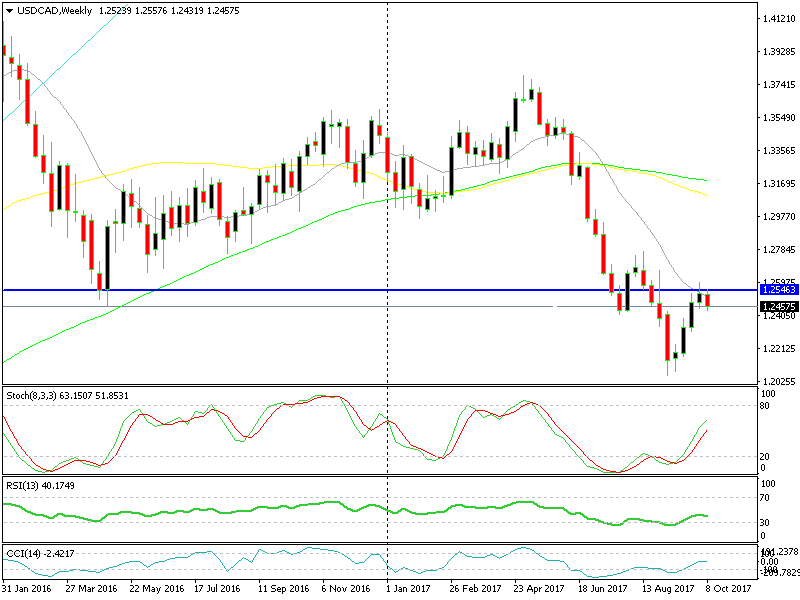
Not quite, the weekly chart paints a different picture. The retrace of the last two years that we saw on the monthly chart, here looks like a trend in itself. It is a retrace on the bigger timeframe chart, but on the weekly chart it is a downtrend until it ends and turns higher.
Is it turning higher though?
This forex pair has climbed higher in four consecutive weeks, which is a sign that the downtrend might be over. But this might also be just a retrace of this weekly downtrend.
We have reached the 20 SMA (grey) and stochastic should reach the overbought area soon. Besides, we’re below a long term support level which is now acting as resistance.
Contradicting signals all over. Now what? Well, the technical analysis is a bit messy and the fundamentals are all over the lace as well. In this occasion, it’s best to just watch how things evolve for some time. The situation will clear out in a couple of weeks.
By the way, there’s a case on the weekly chart for a medium term signal targeting 100-200 pips. The idea would be to sell below the 20 SMA with a stop above it. Even if the trend reverses higher, I think that the sellers might want to have another try before giving up. So, if it suits your money management strategy then you can give it a try.
- Check out our free forex signals
- Follow the top economic events on FX Leaders economic calendar
- Trade better, discover more Forex Trading Strategies
- Open a FREE Trading Account
- Read our latest reviews on: Avatrade, Exness, HFM and XM
Related Articles


Sidebar rates
Related Posts
