Is There More Downside Potential in Gold After Cashing in on Our Signal?
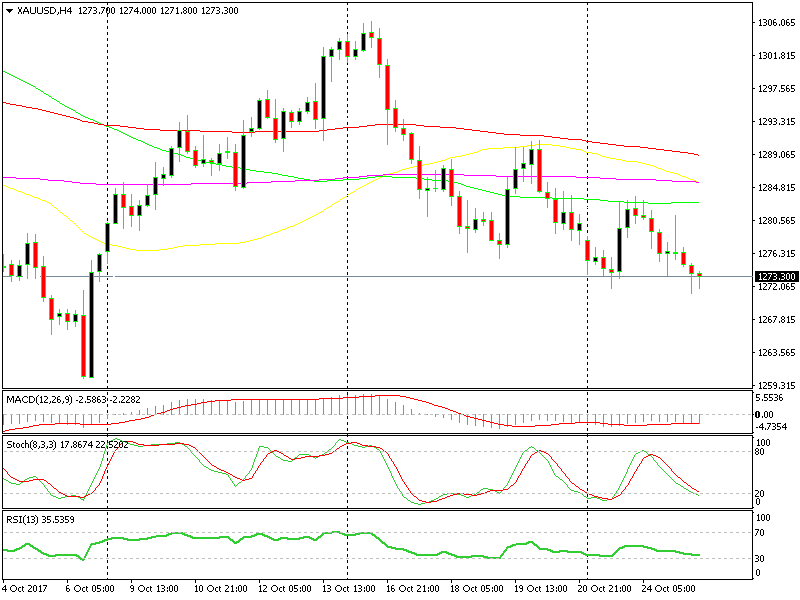
Yesterday we opened a Gold signal based on the H4 chart. As we explained yesterday and as the H4 chart below shows, the trade was pretty st
Yesterday we opened a Gold signal based on the H4 chart. As we explained yesterday and as the H4 chart below shows, the trade was pretty straightforward.Gold became overbought on this chart after a decent retrace on a downtrend. The 100 SMA (green) was also providing resistance on top. So, we took that trade and it unfolded as expected.
 The setup on the H4 chart worked like Swiss watch.
Now, the H4 chart is oversold which means that the downside has been explored. The stochastic indicator is oversold on the H4 chart as well as on the daily chart.
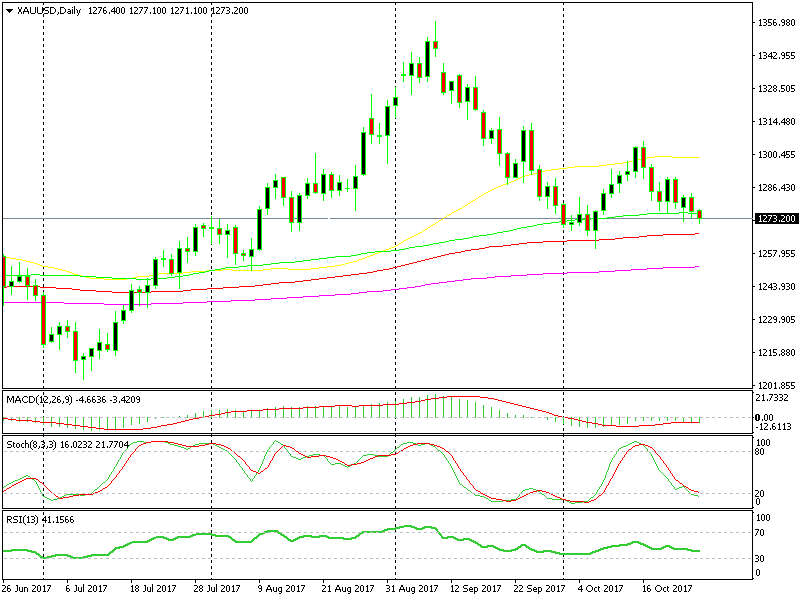
Although, if we look at the daily chart, we see that the price is headed for the 100 smoothed moving average (red). That moving average has been acting as support in the last couple of months.
 There`s still some downside potential until the 100 SMA.
So, the daily chart shows that there’s still some more room left on the downside. The 100 SMA comes at around $1,266 which means a $6 potential. The 200 SMA (purple) stands at $1,252, which means a $20 potential for shorts.
But, the risk/reward ratio is not that great if you want to sell right now. The best practice would be to wait for a retrace on the hourly chart, probably to the 100 SMA (green) at $1,280 before going short with a stop above that moving average.
- Check out our free forex signals
- Follow the top economic events on FX Leaders economic calendar
- Trade better, discover more Forex Trading Strategies
- Open a FREE Trading Account
- Read our latest reviews on: Avatrade, Exness, HFM and XM
Related Articles

Sidebar rates
Related Posts
