Euro Completes a Round Trip after Draghi and the ECB
EUR/GBP has been trading in a relatively tight range in the last several days. The top of the range has been formed around 0.8840-50
EUR/GBP has been trading in a relatively tight range in the last several days. The top of the range has been formed around 0.8840-50 and slipping down to the 30s in the last couple of days. The bottom of the range used to be at the 0.88 level, but is has also moved lower to 0.8780-90 now.
We had two winning forex signals during this time, selling near the top of the range. We also had a winning buy signal which we opened last week. That signal closed in profit as well.
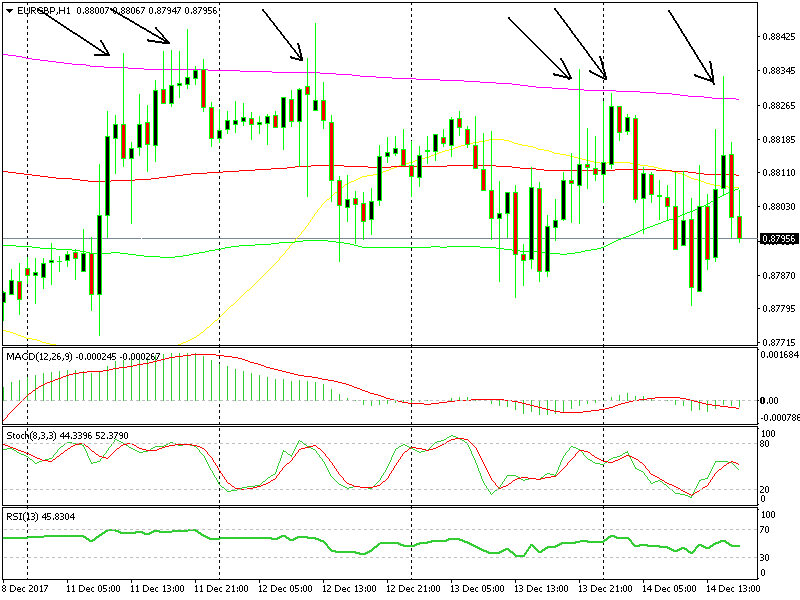
The 200 SMA has provided solid resistance
Although, we could have had a few more winning signals from this pair though. As you can see from the H1 forex chart, the price has kissed the 200 SMA (purple) many times in the last two weeks and has swiftly reversed lower. So, this moving average has been the perfect indicator for sellers.
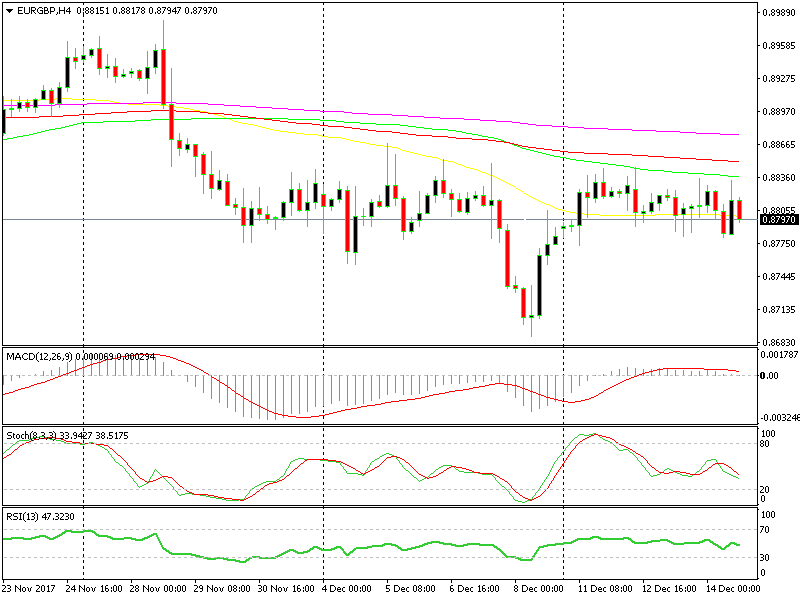
The 50 and 100 SMAs are the ones providing resistance on the H4 chart
Switching to the H4 EUR/GBP chart, we see that the moving averages have been doing a great job here as well providing resistance. Last week it was the 50 SMA (yellow) which capped the spikes, while this week it has been the 100 SMA (green) that has provided solid resistance.
We missed a couple of opportunities last night and today when the price touched the 200 SMA twice on the H1 chart. Well, the resistance remains in place and this moving average is still there, so if we see another surge higher to that MA, we will make sure not to miss again.
- Check out our free forex signals
- Follow the top economic events on FX Leaders economic calendar
- Trade better, discover more Forex Trading Strategies
- Open a FREE Trading Account
- Read our latest reviews on: Avatrade, Exness, HFM and XM
Related Articles

Sidebar rates
Related Posts
