Shorting GBP/USD at the 200 SMA
GBP/USD has been trading in a range in the last few days and right now it is finding resistance at the 200 SMA
[[GBP/USD]] was trading on a strong bearish trend during May, losing around 600 pips from top to bottom as Theresa May’s Brexit plan failed to pass the British Parliament, leading to her resigning from the Prime Minister post in the coming weeks. Retraces were really weak during that time, so the pressure to the downside was immense.
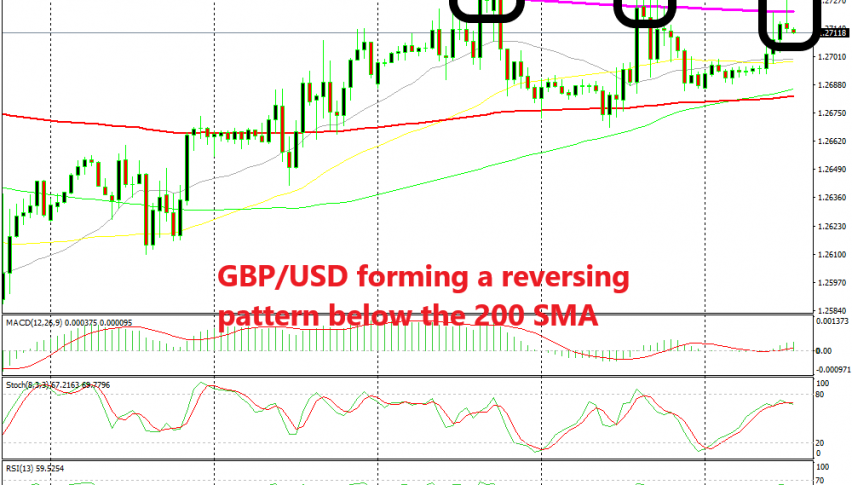
But we saw a reversal last Friday after some weak economic data from the US. The USD turned bearish that day and it has been bearish all this week, hence the uptrend this week in GBP/USD. Although, in the last few days, this pair has traded sideways inside a range between the 200 SMA (purple) at the top and the 100 SMA (red) at the bottom.
The 200 SMA has turned into a solid resistance indicator in the H1 chart for GBP/USD and the price is trading just below it right now. The previous candlestick that just ended closed as an upside-down hammer which is a strong reversing signal and stochastic is overbought, so the chart setup points to a bearish reversal. For these reasons, we decided to sell this pair.
- Check out our free forex signals
- Follow the top economic events on FX Leaders economic calendar
- Trade better, discover more Forex Trading Strategies
- Open a FREE Trading Account
- Read our latest reviews on: Avatrade, Exness, HFM and XM
Related Articles


Sidebar rates
Related Posts
