Going Short on USD/JPY as This Pair Struggles at the 50 SMA
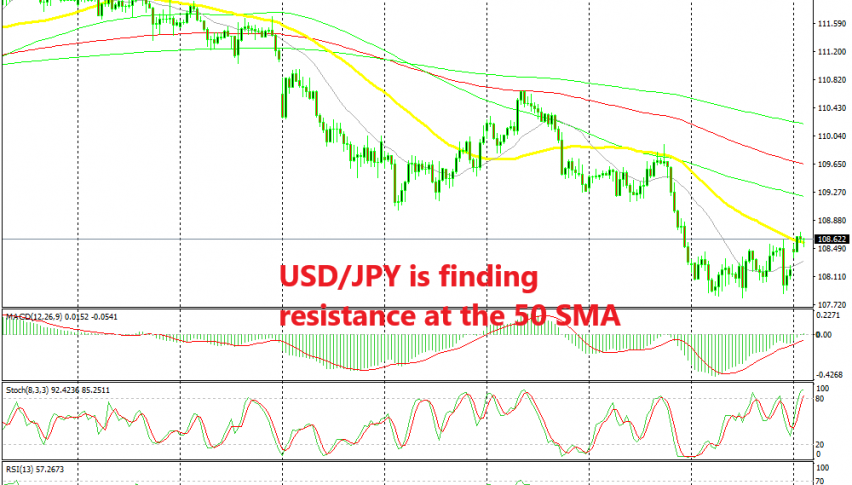
USD/JPY has retraced higher today, but the main trend is still bearish and the pullback is now complete on the H4 chart
[[USD/JPY]] turned pretty bearish at the beginning of May as the market sentiment turned negative and safe havens benefited. During this time, this pair lost more than 300 pips from top to bottom, breaking below the 108 level last week. Although, the price consolidated during last week, while today it has been retracing higher.
USD/JPY has reached the 50 SMA (yellow) on the H4 time-frame where it has been hanging around during the European session. The price has moved above and below it a few times but this still doesn’t feel like a proper break because we are not seeing a clear move above the 50 SMA.
The stochastic indicator is also overbought on the H4 chart, which means that the retrace higher is complete now. Besides that, the sentiment in financial markets remains pretty negative, with risk currencies slipping lower today, so I expect this pullback to end soon and the bearish trend to resume. We opened a sell signal at the 50 SMA and now we’re waiting for the reversal to come.
- Check out our free forex signals
- Follow the top economic events on FX Leaders economic calendar
- Trade better, discover more Forex Trading Strategies
- Open a FREE Trading Account
- Read our latest reviews on: Avatrade, Exness, HFM and XM
Related Articles

Sidebar rates
Related Posts
