WTI Crude Oil Turns Bullish, Moving Above MAs
Crude Oil turned bullish yesterday after the Brexit deal was reached and broke above the 100 SMA on the H4 chart
Crude Oil jumped higher by the middle of last month, jumping nearly $10 after the drone attack on Saudi Arabia’s Oil production and refining facilities. But, the Saudis restored full production capacity pretty fast, which turned the Oil market back where it was, bearish, since the global economy is still weakening.
US WTI crude lost around $12, falling to $51 until the end of the first week of this month. During that period, the 20 SMA (grey) was providing resistance on the H4 time-frame chart, pushing the price lower. That shows the trend was pretty strong, since sellers were not waiting for larger moving averages to catch up.
But, sellers couldn’t push below $51, which seems to have turned into a support area for now. US Crude Oil traded sideways in a range in the second week of this month and the 50 SMA (yellow) turned into resistance. I opened a long term sell forex signal at those moving averages and pocketed some nice profit with that trade.
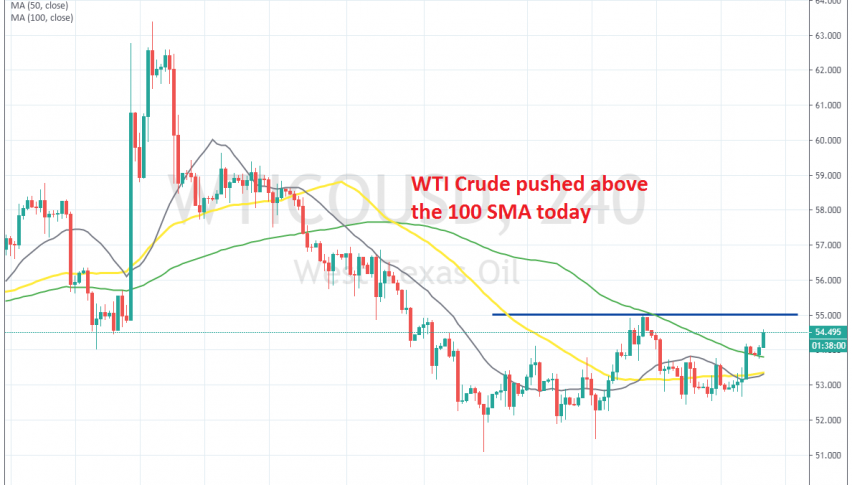
Although, buyers became active by the end of last week after US and China hinted at a partial trade deal, which improved the sentiment in financial markets, sending risk assets such as Oil higher. But, the 100 SMA (green) turned into resistance for US Oil.
The price turned back down at around $55, but yesterday buyers came in again after the Brexit deal was reached and the 100 MSA was broken. Now, US crude Oil faces last week’s high at $55, where we might open a sell signal if that level offers resistance again. So, we will follow the price action when it gets up there, to see reversing signs.
- Check out our free forex signals
- Follow the top economic events on FX Leaders economic calendar
- Trade better, discover more Forex Trading Strategies
- Open a FREE Trading Account
- Read our latest reviews on: Avatrade, Exness, HFM and XM
Related Articles


Sidebar rates
Related Posts
