Bitcoin Finds Support at the 100 SMA, After Moving Above it
Bitcoin has been bearish since summer last year, but the trend might be changing as it moves above MAs on the daily chart
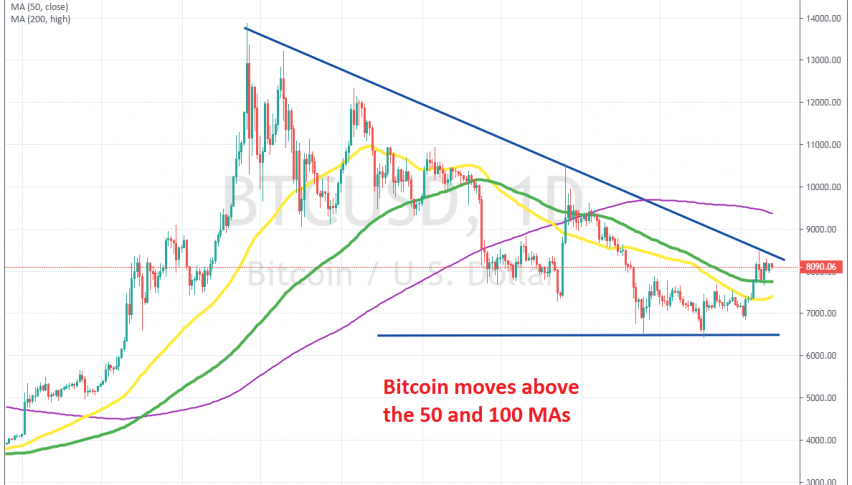
Cryptocurrencies turned quite bullish in Q2 of last year, with BITCOIN climbing more than $10,000. But, the climb ended below $14,000 and it started pulling back lower since then. It wasn’t clear at first if Bitcoin was just retracing lower before the next assault higher, or if the trend was turning bearish.
But it became increasingly evident as moving averages were being broken on the daily chart and the highs were getting lower. So, the trend changed and moving averages turned from support into resistance, particularly the 100 SMA (green) and the 50 SMA (yellow).
But, the decline stopped around the $6,500 level, where it formed a support zone around there at the end of last year. In December we saw a bullish move higher, but the 50 SMA continued to provide resistance, so Bitcoin closed the year bearish.
Although, in the first week of this year, buyers pushed above the 50 SMA and above the 100 SMA as well. The lows are still getting lower and the descending trend-line provided resistance in the first attempt, but the break above the two moving averages is a good signal for a possible trend reversal.
If that’s the case, then buying against these MAs would be a good trade, since the 100 SMA has already turned into support. Although, it would be better to wait and see if the price will move above the descending trend line. That would be a confirmation that the trend is changing.
- Check out our free forex signals
- Follow the top economic events on FX Leaders economic calendar
- Trade better, discover more Forex Trading Strategies
- Open a FREE Trading Account
- Read our latest reviews on: Avatrade, Exness, HFM and XM
Related Articles


Sidebar rates
Related Posts
