The 20 Daily SMA Keeps Pushing Bitcoin Higher
Bitcoin has turned bullish this year and the 20 SMA is pushing the price higher on the daily chart
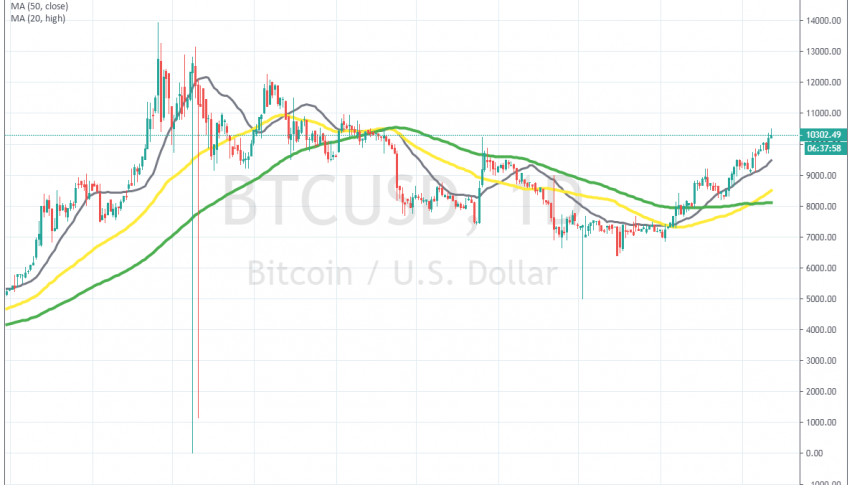
Cryptocurrencies turned quite bullish in Q2 of last year, with BITCOIN surging to $13,800 back in June, after trading sideways in a range between $3,000 and $4,000 during most of Q1. Although, the upside momentum faded after that surge and since late June, Bitcoin has been retracing lower.
The price fell pretty close to $6,000, which means retracing lower more than 50% during this time. But, the decline ended with 2019 and since early January, cryptocurrencies have been grinding higher. Bitcoin was finding some form of resistance at the 20 SMA (grey) in December, but it eventually moved above it.
The 100 SMA (green) on the daily chart, was broken in January this year, which was a strong sign that the decline was over for Bitcoin. The 20 SMA turned into support and it has been pushing the price higher since then. Last week we saw a retrace lower, but it seemed pretty weak and the price bounced off the 20 SMA, so the pressure is to the upside for Bitcoin now.
- Check out our free forex signals
- Follow the top economic events on FX Leaders economic calendar
- Trade better, discover more Forex Trading Strategies
- Open a FREE Trading Account
- Read our latest reviews on: Avatrade, Exness, HFM and XM
Related Articles


Sidebar rates
Related Posts
