Let’s See if Buyers Will Push Higher in AUD/USD
AUD/USD retraced higher last week and reached the 20 SMA on the daily chart
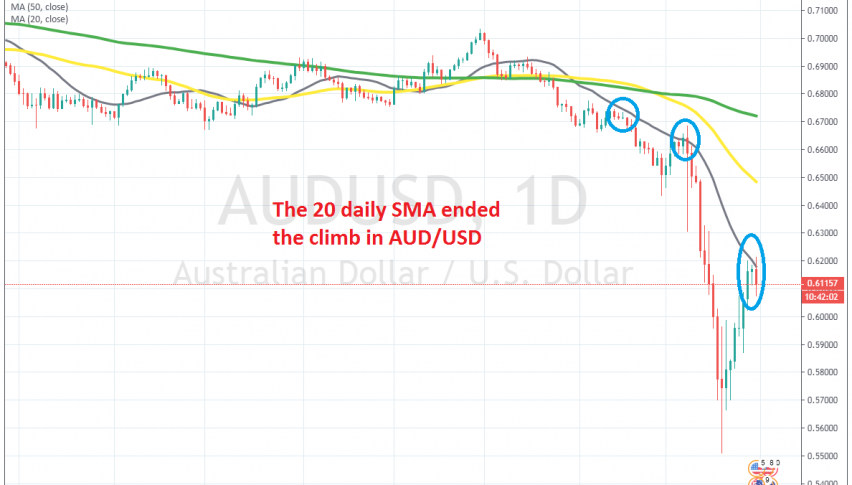
As most other financial assets, AUD/USD has also gone through a roller-coaster in the last month or so. This pair was trading at $0.70 at the beginning of this year, but crashed down to $0.55 earlier this month, which means a decline larger than 10 cents. I am glad we caught some of that decline, making around 300 pips selling this pair this month.
The 20 SMA (grey) has been standing ready to provide resistance above, on the daily chart. But, the decline was so ferocious that even the smallest moving average couldn’t exactly catch up with the decline. So, AUD/USD fell to $0.55 as traders turned towards the USD in these turbulent times, which is the world’s reserve currency.
But last week, the USD retreated and suffered some major losses. As a result, this pair retraced around 7 cents higher, from $0.55 to $0.62. Although, it seems like buyers are having trouble pushing above the 20 SMA now on this time-frame.
- Check out our free forex signals
- Follow the top economic events on FX Leaders economic calendar
- Trade better, discover more Forex Trading Strategies
- Open a FREE Trading Account
- Read our latest reviews on: Avatrade, Exness, HFM and XM
Related Articles


Sidebar rates
Related Posts
