Cashing In On GBP/USD, After Selling at the 50 SMA
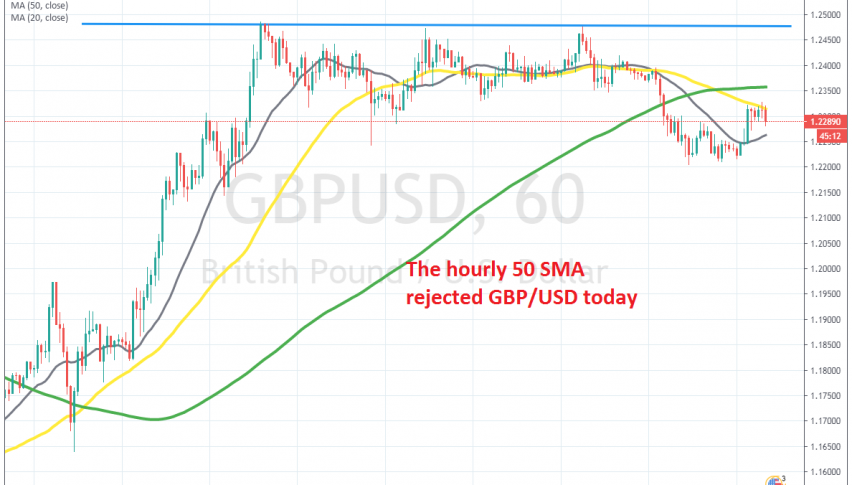
GBP/USD retraced higher today, but the retrace ended at the 50 SMA, where we decided to sell
[[GBP/USD]] traded sideways all week last week, after climbing more than 10 cents higher in the previous week. Climbing 10 cents in a week is quite a lot, but that came after an even bigger decline, worth around 18 cents in the previous two weeks, so the volatility has been enormous.
Anyway, buyers failed to push above the big round level at 1.25 last week, with the high being around 1.2480s. That level offered resistance all of last week, rejecting the price three times, which showed that buyers were running out of steam at 1.2480s.
On Friday though, sellers came in and pushed the price lower to around 1.22 before the week ended. Although, it seemed like a selloff before the weekend, just in case the world ended over the weekend. Today, we saw a move higher in this pair, but the climb ended at the 50 SMA (yellow) on the H1 chart. A doji candlestick formed up there, which is a reversing signal and we decided to sell. Now the price has reversed down and it just reached our take profit target, so that trade went well.
- Check out our free forex signals
- Follow the top economic events on FX Leaders economic calendar
- Trade better, discover more Forex Trading Strategies
- Open a FREE Trading Account