The Climb in GBP/USD Stops at the 50 SMA
GBP/USD has retraced higher in the last few sessions, but the retrace seems complete at the 100 SMA
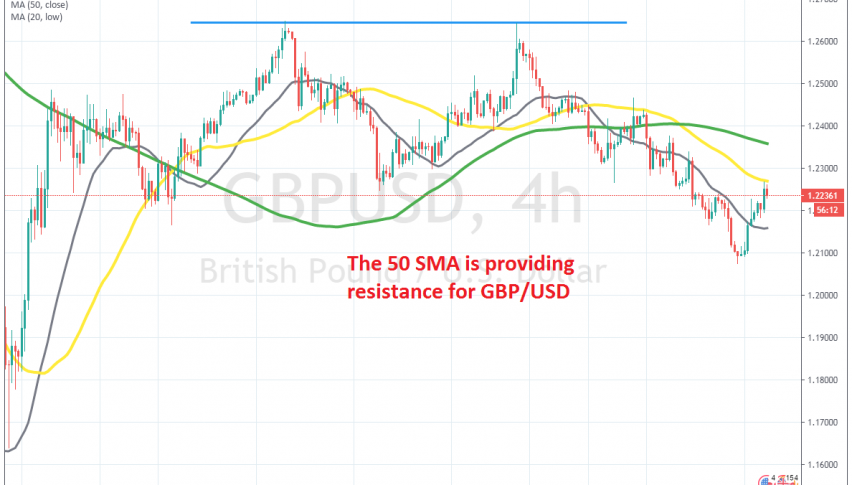
[[GBP/USD]] turned bearish at the beginning of this month and has been declining since then. That decline came after this pair had been making a strong climb during the second half of March and the first half of April, but the climb stopped back then and a top was put in place at 1.2650s, which provided resistance last month.
Then, GBP/USD turned bearish as soon as the current month started and it lost nearly 600 pips from top to bottom, which was put in place last Friday. But, the decline stopped as the week closed and yesterday this pair started to retrace higher, as the USD turned bearish.
This pair started to retrace higher and it broke the 50 SMA (yellow) on the H4 chart without much hesitation. The pullback continued today as well and at some point GBP/USD was 200 pips higher from the lows, but the pullback ended right at the 100 SMA (green) on the H4 chart, which provided resistance earlier this month. So, we decided to open a sell forex signal up there and now this pair is reversing down, and the trade seems good at the moment.
- Check out our free forex signals
- Follow the top economic events on FX Leaders economic calendar
- Trade better, discover more Forex Trading Strategies
- Open a FREE Trading Account
- Read our latest reviews on: Avatrade, Exness, HFM and XM
Related Articles


Sidebar rates
Related Posts
