Going Long on USD/JPY
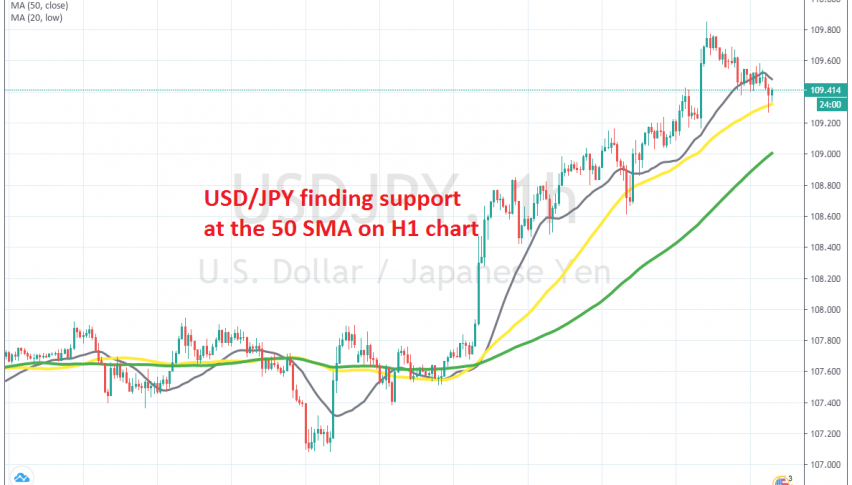
USD/JPY retraced lower today, but the 50 SMA is holding well as support on the H1 chart
[[USD/JPY]] turned bullish by the middle of March, after it had crashed around 12 cents lower. It made a quick reversal and climbed around 10 cents higher in the second half of that month, but the climb ended at 111.70 and this pair retraced back lower.
During most of May, USD/JPY traded sideways inside a range, with the 50 SMA (yellow) providing resistance on the daily chart. Last week though, this pair turned bullish again and broke above that moving average, reaching 109.80s on Friday last week.
Although, the price has retraced lower today, as the USD tries to recover some of last week’s losses. This pair slipped below the 20 SMA (grey) on the H1 chart, but it seems like the 50 SMA (yellow) is now providing support. This moving average is holding well and USD/JPY is bouncing off of it, so we decided to go long on this pair above the 50 SMA, since the retrace is complete now.
- Check out our free forex signals
- Follow the top economic events on FX Leaders economic calendar
- Trade better, discover more Forex Trading Strategies
- Open a FREE Trading Account
- Read our latest reviews on: Avatrade, Exness, HFM and XM
Related Articles


Sidebar rates
Related Posts
