Gold Turns Lower, As It Gets Rejected by the 50 SMA
Gold is slipping lower now, after failing to climb above the 50 SMA
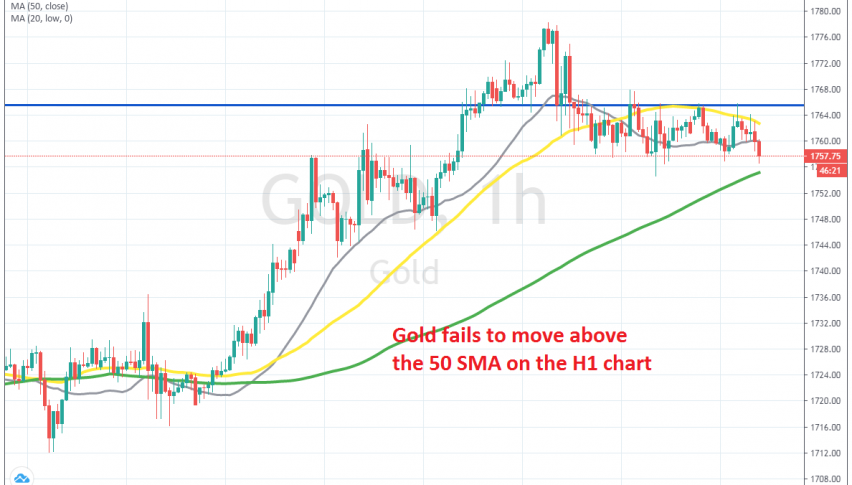
GOLD has been quite bullish all this year, as the uncertainty increased and safe havens attracted a lot of bids. But, towards the end of May we saw Gold make another bullish leg higher, as the USD weakened and the price reached $1,778 a few days ago, as seen from the H1 chart above.
But the climb ended on Wednesday and the price returned $20 lower. Buyers had another attempt at the top side, but they gave up lower in the second attempt, which was a sign that the buying pressure was running out of steam. Gold fell lower, but the 20 SMA (grey) is providing support on the H4 chart.
On the H1 chart though, the 50 SMA (yellow) has turned into resistance now. Gold fell below it yesterday and it turned into resistance immediately. We have seen several attempts from buyers to push above this moving average, but they have all failed.
So, the pressure has turned to the downside for Gold now and it should continue to slip until the 100 SMA (green) now. But, beware the end of the week, which might turn the attention to safe havens again before the weekend.So, we might even try a small long position form the 100 SMA, targeting the 50 MA at the top on the H1 chart.
- Check out our free forex signals
- Follow the top economic events on FX Leaders economic calendar
- Trade better, discover more Forex Trading Strategies
- Open a FREE Trading Account
- Read our latest reviews on: Avatrade, Exness, HFM and XM
Related Articles

Sidebar rates
Related Posts
