USD/JPY Shows Weakness at the 200 Daily SMA
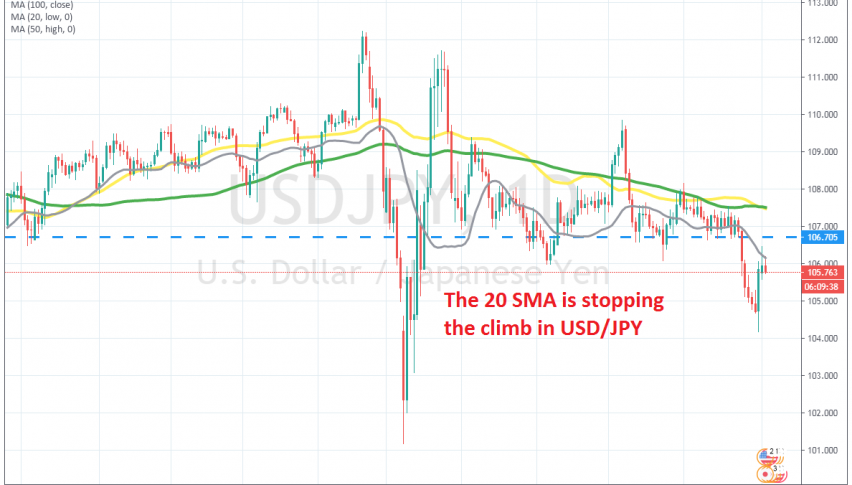
The climb ended at the 20 SMA for USD/JPY yesterday on the daily chart

[[USD/JPY]] was trading in a slight bullish trend during the last few months of last year, and early this year, until the coronavirus broke out. But, the panic set in during late February and early March and this pair dived around 11 cents lower in a few weeks.
The sentiment improved somewhat, and the safe havens retreated, as traders turned to the USD for some time. USD/JPY claimed back almost all the losses, but it didn’t keep the bullish trend. In fact, we can see form the daily chart that the pressure has been on the downside for this pair.
Moving averages have turned into resistance, apart from one occasion in early June. They have been killing the pullbacks higher, reversing USD/JPY lower. In late July, the decline picked up pace as the USD weakened further, sending this pair 300 pips lower. Earlier this week we saw a jump higher, but MAs are still acting as resistance, with the 20 SMA stopping the climb.
The price pierced this moving average briefly, but USD/JPY returned back down, Yesterday we saw another attempt at the 20 daily SMA, but buyers failed again and this pair started to reverse lower. So, the pressure still remains to the downside and we wil try to sell retraces higher.
- Check out our free forex signals
- Follow the top economic events on FX Leaders economic calendar
- Trade better, discover more Forex Trading Strategies
- Open a FREE Trading Account


