Will the 50 Daily SMA End the Retrace in Gold Again?
Gold is facing the 50 SMA on the daily chart now, as it crawls higher
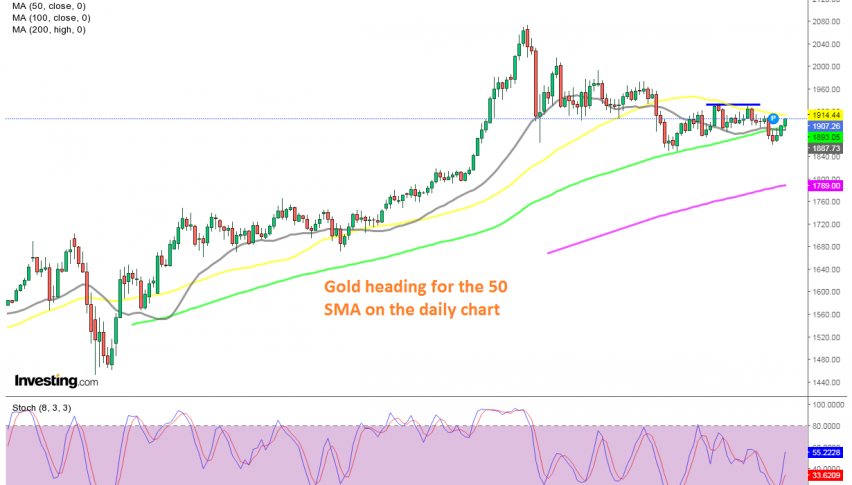
GOLD has turned bearish since the second week of August. It used to be really bullish all this year until that time, as the coronavirus lock-downs sent the global economy diving lower, thus sending safe havens higher. But, the climb ended at $2,075 and Gold started to reverse lower.
Moving averages turned into support at first, with the 50 SMA (yellow) doing so during September, although that moving average was broken by the end of that month. The 100 SMA (green) turned into support after that and the price bounced higher off that moving average.
Although, the 50 SMA turned into resistance in October and reversed the price lower. The 100 SMA was eventually broken, as the bearish momentum continues, but this week the USD is declining ahead of the US elections and Gold moved above the 100 SMA again.
The price is heading for the 50 SMA, so let’s see if that moving average will hold as resistance again. If it does and we get a reversing signal, such as a doji or upside-down pin candlestick, then we might open a sell forex signal here. Although, we will see the reaction tomorrow after the elections.
- Check out our free forex signals
- Follow the top economic events on FX Leaders economic calendar
- Trade better, discover more Forex Trading Strategies
- Open a FREE Trading Account
- Read our latest reviews on: Avatrade, Exness, HFM and XM
Related Articles


Sidebar rates
Related Posts
