AUD/USD Trying to Break the 50 Daily SMA
AUD/USD has turned bullish again this week, climbing to the 50 daily SMA
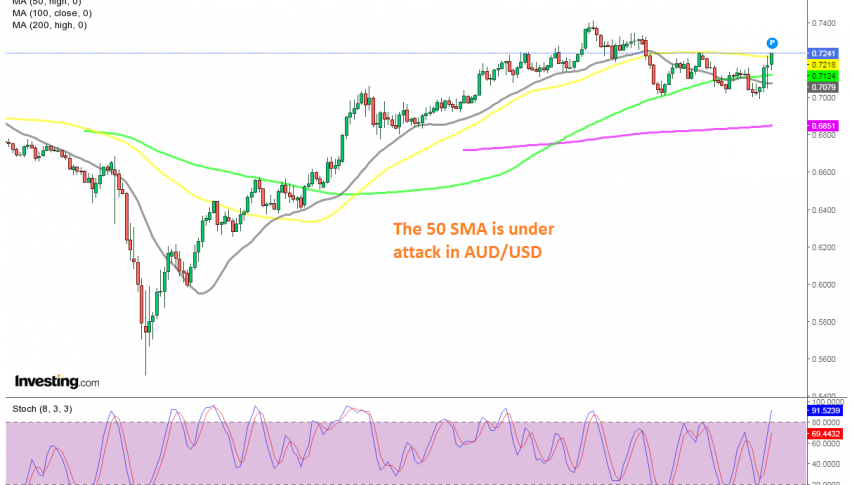
The AUD/USD has been one of the most bullish pairs since March, climbing around 19 cents in total. During the bullish trend, the 20 SMA (gray) was providing solid support for this pair, as the buying pressure was quite strong, with the USD tumbling lower since the middle of March.
But the bullish momentum came to an end at the end of August, and after the price formed an upside-down candlestick, which is a bearish reversing signal after the strong bullish trend, the 20 SMA and the 50 SMA (yellow) were broken, but the 100 SMA (green) turned into support on the daily chart.
The price bounced off the 100 SMA, but the 50 SMA turned into resistance, rejecting the AUD/USD. The 100 SMA was eventually broken on the daily chart, as the USD gained strength, but this week the buck turned bearish again, based on US election risks. The AUD/USD has climbed around 250 pips and it is trying to break the 50 SMA now. If it doesn’t we might try to go short, although the situation is too risky at the moment, as we await the legal battle between the two presidential candidates in the US elections.
- Check out our free forex signals
- Follow the top economic events on FX Leaders economic calendar
- Trade better, discover more Forex Trading Strategies
- Open a FREE Trading Account
- Read our latest reviews on: Avatrade, Exness, HFM and XM
Related Articles


Sidebar rates
Related Posts
