USD/CAD Forming a Bullish Reversing Pattern at the 50 SMA
USD/CAD has been finding solid support at the 50 SMA and is starting to bounce higher
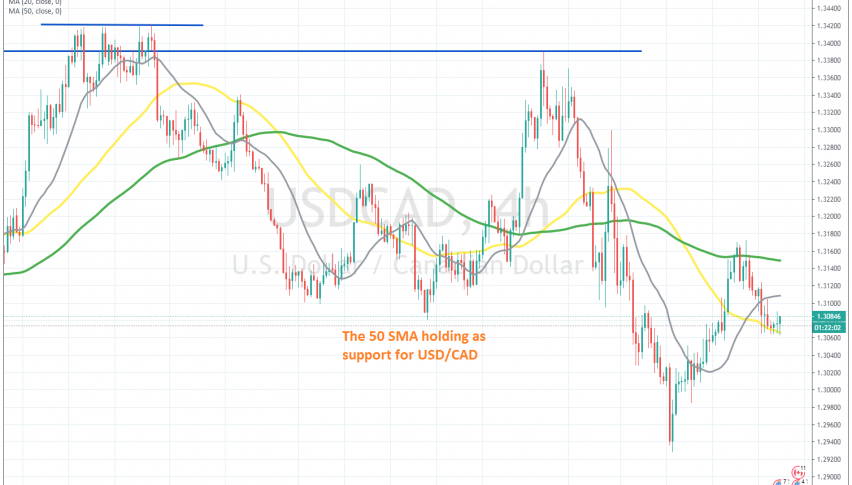
The USD/CAD turned bearish during the US election week, as the USD tumbled lower. The price fell nearly 500 pips, from close to 1.34, to 1.2920s. That confirmed the break of the big round level at 1.30, after the first dip below it on September 1 only lasted a few hours and the price climbed back up again, so that didn’t really count as a break.
Now that level has finally been broken, although the price reversed higher last Monday, as the Pfizer coronavirus vaccine news improved the sentiment for the USD. But the climb stopped around the 100 SMA (green) on the H4 chart and it reversed back down.
However, the decline seems to have stopped at the 50 SMA (yellow) now, which has been providing support since yesterday. The price formed a few doji candlesticks above it, which are bullish reversing signals after the decline., and now the USD/CAD is starting to reverse higher. We might go long from here, targeting the 100 SMA, which stands around 100 pips higher from the 50 SMA.
- Check out our free forex signals
- Follow the top economic events on FX Leaders economic calendar
- Trade better, discover more Forex Trading Strategies
- Open a FREE Trading Account
- Read our latest reviews on: Avatrade, Exness, HFM and XM
Related Articles


Sidebar rates
Related Posts
