Selling AUD/USD at the 20 SMA, As It Turns Form Support to Resistance
AUD/USD has reversed lower this week and the 200 SMA has turned into resistance now
Risk currencies such as the commodity Dollars have been on a strong bullish trend since March last year. AUD/USD has climbed more than 23 cents from the bottom and during this time moving averages have been a great job as support during pullbacks lower.
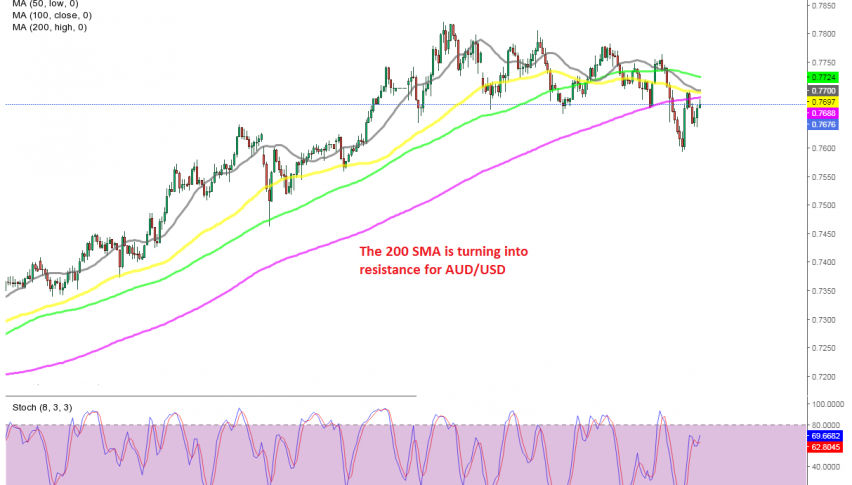
The bullish trend has been quite consistent, particularly since early November after the US presidential elections were over. The 20 SMA (gray) has been acting as support on the daily chart, while on the H4 chart above, the 50 SMA (yellow) and the 100 SMA (green) have worked as support.
Although, the 20 SMA was broken on the daily chart earlier this month and now it has turned into resistance. On the H4 chart, the MAs which were providing support were broken and now it seems like the 200 SMA has turned into resistance. So, we decided to take a trade here and just opened a sell forex signal below that moving average. Now the price is reversing lower, so let’s hope the decline continues.
- Check out our free forex signals
- Follow the top economic events on FX Leaders economic calendar
- Trade better, discover more Forex Trading Strategies
- Open a FREE Trading Account
- Read our latest reviews on: Avatrade, Exness, HFM and XM
Related Articles


Sidebar rates
Related Posts
