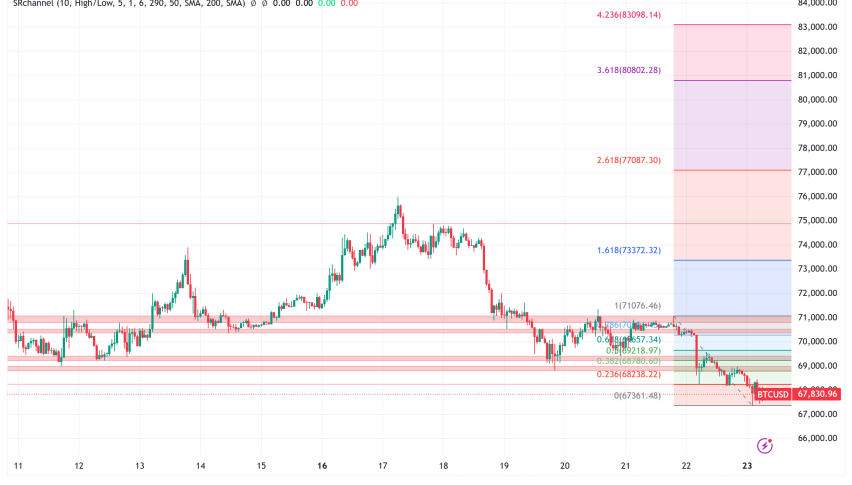
Bitcoin Stuck Between Moving Averages
Bitcoin is finding support at the 100 SMA and resistance at the 50 SMA
Cryptocurrencies resumed the bullish trend this month, after plunging lower in the last week of February. Although, that retrace was overdue after a massive surge, which lased for a few months, sending BITCOIN to $ 58,000.
After the pullback, the new bullish trend took the price above $ 60,000 at the end of last week, making new highs for this crypto. Bitcoin retreated lower after that, losing around $ 8,000 in the first two days of this week.
Although, the price is reversing above the 100 SMA (green) on the H4 chart, which is acting as support on this time-frame. At the top, we have the 50 SMA (yellow) which is acting as resistance, so Bitcoin is sort of stuck between these two moving averages now. The bias is on the upside, but let’s see which moving average will go first.
- Check out our free forex signals
- Follow the top economic events on FX Leaders economic calendar
- Trade better, discover more Forex Trading Strategies
- Open a FREE Trading Account
- Read our latest reviews on: Avatrade, Exness, HFM and XM
Related Articles

Sidebar rates
Related Posts
