MAs Provide Support for Fantom Crypto (FTM) and Resistance for Ethereum (ETH)
Fantom crypto FTM turning bullish at 200 daily SMA, Ethereum is turning bearish at the 50 SMA

The 3-month decline in cryptocurrencies seems to have stopped for now, but there is uncertainty after the reversal higher in the last few weeks. Different countries are moving ahead with crypto regulation, which is an uncertain ground. They’re not exactly banning them, but regulating them goes against the crypto nature. So, there is uncertainty now, although Ethereum and Fantom cryptos seem to be supported on the daily charts.
Fantom Daily Chart Analysis – The 200 SMA Keeps Holding As Support for FTM

FTM consolidating between 2 support zones
Fantom has become a popular blockchain for developers, due to its compatibility with Ethereum that runs on the Java Runtime Environment (JRE) and JavaScript. That has benefited the FTM coin, which has been one of the most bullish cryptos in recent months, attempting to make a new high in January, when the market was still quite bearish.
After the retreat in November, FTM/USD found support at the 200 daily SMA (purple), which is still acting as support holding Fantom late last week. The support zone below $2 is also holding, which looks like a great place to buy Fantom coins. The TVL on the Fantom network stands at around $8.46 billion, coming down from $12.8 billion at the end of January, while the market cap stands at $5.08 billion, which shows that Fantom’s DeFi sector is in good shape. Today the crypto market has turned bearish again, but the support seems to be holding strong for FTM, so we are preparing to open a buy signal here.
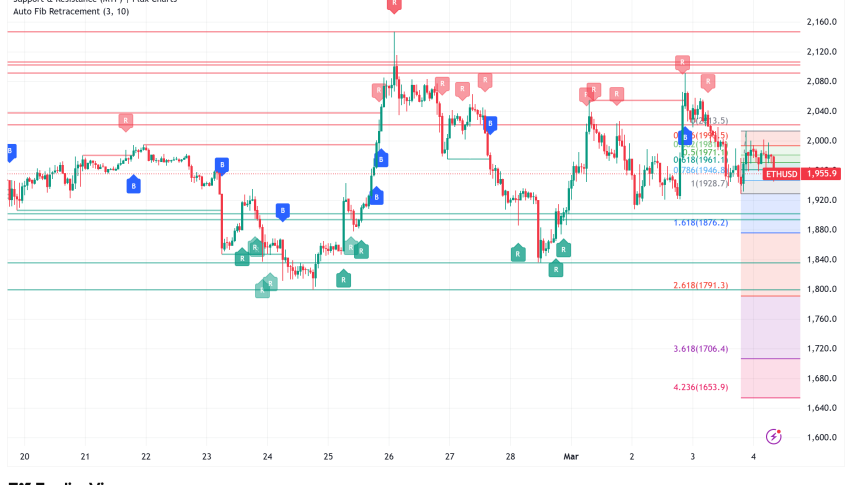
Ethereum Daily Chart Analysis – The 50 SMA Rejecting ETH Again

Ethereum reversing back down after the failure at the 50 SMA
The Ethereum blockchain continues to be plagued by high fees as a result of congestion, but founder Vitalin Buterin announced that a feature of blob-carrying transactions will be added in a near-future hard fork. This would increase the scalability of rollups since they will contain a larger amount of data that cannot be accessed by EVM execution.
Although at the moment the market sentiment is driving the price of ETH and today we are seeing a bearish reversal, after the failure to push above the 50 daily SMA. This moving average has rejected the price for the second time this month, which shows that the below $3,000 held so there is a chance that it holds again after this reversal down. If the decline stops there, then we might consider buying ETH/USD down there.
Ethereum Coin ETH Live Chart
- Check out our free forex signals
- Follow the top economic events on FX Leaders economic calendar
- Trade better, discover more Forex Trading Strategies
- Open a FREE Trading Account
- Read our latest reviews on: Avatrade, Exness, HFM and XM
Related Articles