US Stock Markets Remain Heavily Bearish As Uncertainty Prevails
It seems like the party in the stock markets is over. It started two years ago after the initial coronavirus dip which didn’t last long, as central banks and governments around the world went into panic mode and started the most massive stimulus programmes in history.
Tens of trillions of dollars were spent/injected into the global economy which has increased inflation and sent prices higher. Stock markets had the strongest rally in history as well, as large sums of this cahs spilled into stock markets. NASDAQ surged from 6,800 points to 16.800 points, meaning that it had gained much more during this period than during its entire history.
US Stock Index NASDAQ100 Daily Chart

The 20 SMA has turned into resistance on the daily chart
During the uptrend, NASDAQ was finding support at moving averages during pullbacks, which were pushing the price higher. But at the beginning of this year, the price reversed lower and this index declined below all moving averages. Now, the 20 SMA (gray) has turned into resistance, so the trend seems to have changed and the decline is quite steep, with the smallest moving average acting as resistance.
US Stock Index S&P500 Live Chart

MAs have turned from support to resistance
S&P500 has also been on a massive bullish trend, as it increased from around $2,200 to $4,800, with the 50 SMA (yellow) and 100 SMA (green) acting as support on the daily chart. Then the reversal came this year, as the FED started to tighten the monetary policy by reducing and eventually ending the QE, while they let the market know that interest rates would start going up from this week’s meeting. The FED released its inflation forecasts, which are higher than the previous ones, suggesting that the FED will keep tightening the policy, probably at a faster pace regarding interest rates.
New York Fed Consumer Economic Survey
- On-year inflation expectations +6.0% vs 5.8% prior
- Three-year inflation survey to 3.8% from 3.5%
- Year ahead home price increase to 5.7% from 6.0%
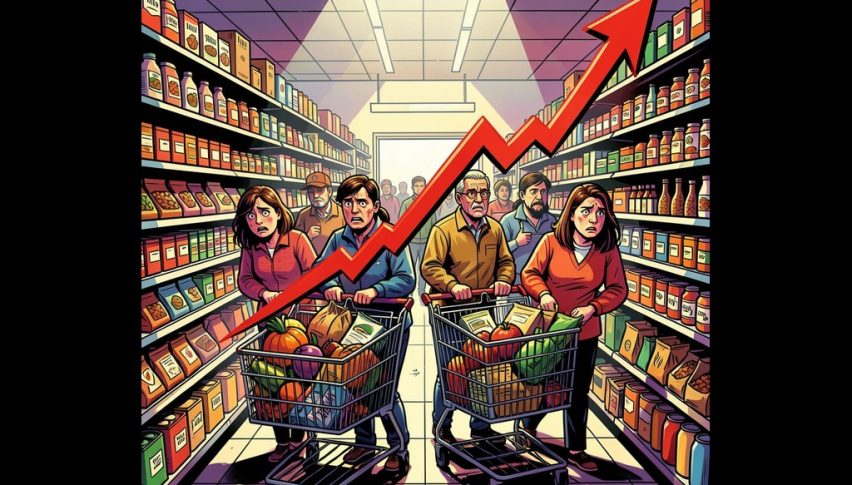
- Year ahead household spending +6.4% +5.5% — new series high
- Year ahead price increase expectations for food to +9.2% from 5.9%
- Year ahead price increase expectations gas to 8.8% from 7.3%
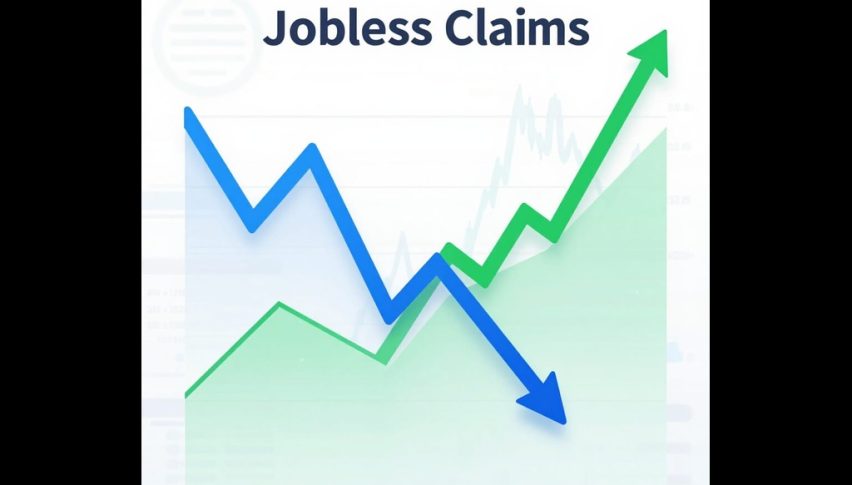
- Perceived probability of losing one’s job in the next 12 months to 10.8% from 11.6% — series low (since 2013)
That three-year inflation number might be the one that gets the most attention from the Fed.
US Index S&P500 Live Chart
- Check out our free forex signals
- Follow the top economic events on FX Leaders economic calendar
- Trade better, discover more Forex Trading Strategies
- Open a FREE Trading Account
- Read our latest reviews on: Avatrade, Exness, HFM and XM
Related Articles

Sidebar rates
Related Posts
