Can MAs Support Ethereum ETH and Cardano ADA, As They Turn Bearish Again?
Cardano ADA and Ethereum ETH have turned lower again, but they are finding some support at moving averages on the daily chart
Cryptocurrencies continue to show uncertainty, failing to take a direction since January. After the major retreat which started in November, cryptocurrencies consolidated in February, and in March we saw a decent attempt to reverse the trend and turn bullish. But, they reversed back down and have been trading in a tight range for more than a week. At least, they’re not making new lows, which is a good sign.
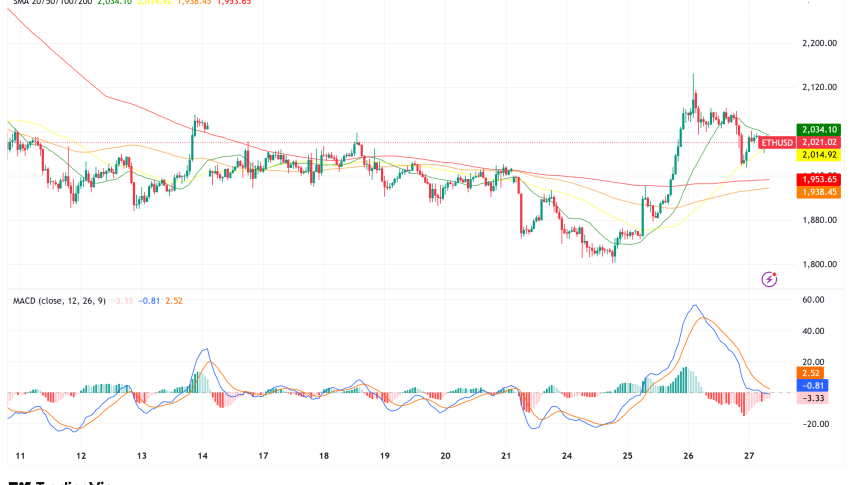
Ethereum Daily Chart – Can MAs Support ETH Again?

Ethereum trading just above $3,000
Ethereum made new highs in November last year, despite the shart retreat in May/June. Although it failed to reach $5,000 and reversed lower in November, but stopped declining in January. In February we saw a consolidation while in March Ethereum showed some bullish pressure, as buyers pushed the crypto market higher. The 50 SMA (yellow) was broken and it turned into support. ETH pushed above $3,000 but it met the 200 SMA (purple) above the $3,500 level where it got rejected.
ETH/USD reversed back down but it has been finding support at the 100 daily SMA (green) for more than a week, while the 20 SMA (gray) has turned into resistance. So the range has become quite narrow, indicating uncertainty from both parties. Ethereum had a successful launch of the first mainnet shadow fork in preparation for Merge. But the Merge with the layer-2 blockchain which should increase scalability, lower fees and increase transaction speed has been postponed for Q3. So until then Ethereum will follow the crypto market sentiment.
Cardano Daily Chart – Can the 50 SMA Hold As Support for ADA?

Cardano has returned below $1 again
After launching the Alonzo upgrade in September last year, ADA/USD turned bearish despite the crypto market pushing to record highs until early November. The price continued to move lower, falling below the support zone. But it formed another support zone around $0.75 last month, where it started to reverse higher, reaching $1.25. That’s a 50% gain, but the reversal back down this month has sent the price below $1 again.
Besides the improved sentiment in the crypto market last month, another reason for the increase in the Cardano price was the potential implementation of a burn mechanism for Cardano. Besides that, Cardano made some upgrades, as the first Hydra Heads launched on the public Cardano testnet. They refer to a collection of Layer 2 solutions aimed at improving network security and scalability. But for now, Cardano trades around $0.90, with a bearish bias, but let’s hope that the 50 daily SMA (yellow) holds as support.
Cardano Token ADA Live Chart
- Check out our free forex signals
- Follow the top economic events on FX Leaders economic calendar
- Trade better, discover more Forex Trading Strategies
- Open a FREE Trading Account
- Read our latest reviews on: Avatrade, Exness, HFM and XM