Can Gold Bounce Off the 50 Monthly SMA and Turn Bullish?
Gold has been bearish since March, but the situation is building up to a bullish reversal both fundamentally and technically
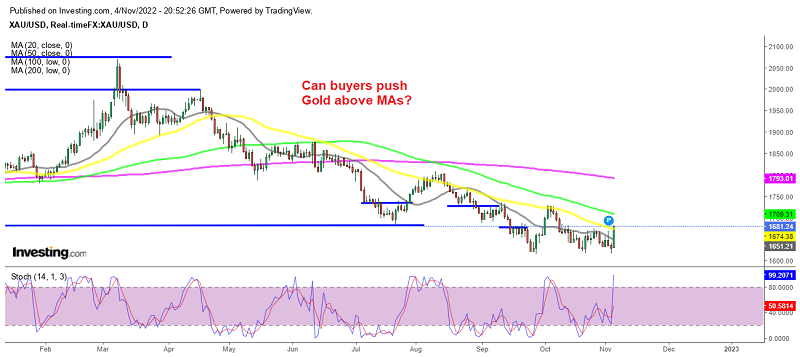
Gold has been declining for seven straight months since it reversed above $2,000 in March and declined around $450 until the bottom at around $1,616, where a support zone has formed. That support held for a couple of weeks and yesterday we saw a really strong bounce which took the price the $1,680, which used to be a strong support area, although it might turn into resistance now. Although, the move was strong so this previous support will probably be broken next week. Judging by the current situation, GOLD has a good chance to turn bullish for some time
1) The Decline Has Been Overstretched
Gold has been declining since March as we mentioned above, posting seven consecutive bearish candlesticks. That’s certainly not a sign of a bull market but nothing falls in a straight line and the decline of 13% is better than many major currencies over the same period. The decline is mostly due to the US dollar gaining massive momentum as the FED tightens.
2) Central Banks Buying Gold Heavily

The World Gold Council reported earlier this week that central banks purchased 400 tons of bullion in Q3, which was nearly double the previous record for Q3. It’s not certain which central banks were buying but eyes are on Russia and China due to the US’s weaponization of the US dollar.
3) Central Banks Are Pivoting
This has been the year when central banks have been the most hawkish in history and in the last 2 weeks, 6 major central banks have raised interest rates, but 5 of them sounded dovish. The FED increased the terminal rate but only “slightly” as Chicago Fed President Charles Evans said yesterday. To be sure, central banks are still hiking but the pace is slowing and markets generally move on what’s coming rather than what’s happening.
China Is Opening
Technicals Are Mixed

On the H1 chart at the top of the article, the trend is still bearish but the price has bounced just above the 50 SMA (yellow). If buyers keep pushing up, then the trend will change. On the monthly chart, there’s still the daunting double top at around $2,070 and the latest bounce looks like a retest of the base of it before a further fall. The measured target of the double top is $1,350. Although, the 50 monthly SMA (yellow) has held as support in the first attempt and we might be seeing the beginning of the bounce. Stochastic is oversold as well, so the bearish move seems complete.
Gold XAU Live Chart
- Check out our free forex signals
- Follow the top economic events on FX Leaders economic calendar
- Trade better, discover more Forex Trading Strategies
- Open a FREE Trading Account
Related Articles


Sidebar rates
Related Posts
