Has the GBP/USD Uptrend Run Its Course?
GBP/USD turned incredibly bullish since the intervention by the BOE at the end of September, but buyers seem to have run out of steam
Markets were slow to start the day, with meaningful news headlines few and far between. Bonds moved up and then down. Stock markets are still looking bearish after the decline yesterday after the higher revision in the US Q3 GDP report. The USD benefited from that and pushed higher against all forex majors, while Gold and Oil turned bearish.
GBP/USD started moving higher in the Asian session but reversed lower after the positive US GDP figures. Although, this pair was feeling heavy even before that, after the final UK Q3 GDP report was revised lower to -0.3% from 0.2% previously.
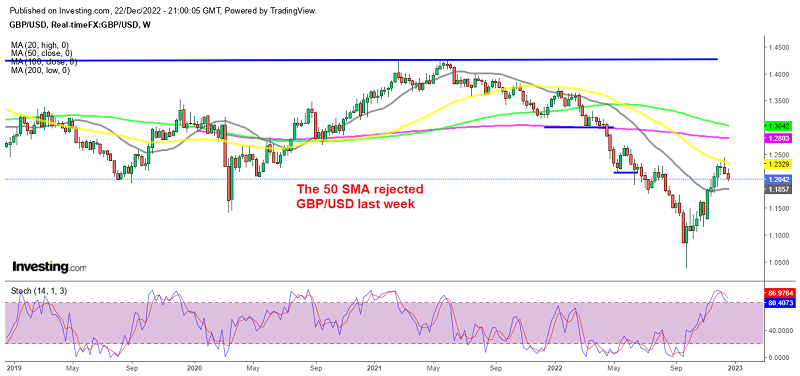
Looking at the weekly GBP/USD chart above, we see that this pair surged from below 1.04 at the end of September, to 1.2450s earlier this month, as the FED rhetoric slowed down. But, buyers failed at the 50 SMA (yellow) which has turned into resistance since early this year and after a doji candlestick which is a bearish reversing sign, the decline came, so now this pair is heading for 1.20 again.
UK Final Q3 GDP Report
- Q3 final GDP QoQ -0.3% vs -0.2% prelim
- GDP YoY +1.9% vs +2.4% prelim
So there was a slight revision lower which confirms the first quarterly drop in UK economic activity since Q1 last year. With Q4 prospects also looking grim, a recession is all but a given and the question now is more of how bad things are with the cost-of-living crisis still increasing across UK households.
GBP/USD Daily Chart – The 200 SMA Is Under Attack

The 20 SMA has been broken
On the daily chart, we see that the 200 SMA (purple) turned into resistance early this year although this moving average was broken as the 20 SMA (gray) turned into support and pushed the price higher. Now after the bearish reversal, the 200 daily SMA is under scrutiny once again as sellers have taken control since last Thursday. So, the weekly chart points further down, while the daily chart is oversold, therefore we might see a bounce up before sellers return and push the price below 1.20.
GBP/USD Live Chart
- Check out our free forex signals
- Follow the top economic events on FX Leaders economic calendar
- Trade better, discover more Forex Trading Strategies
- Open a FREE Trading Account
- Read our latest reviews on: Avatrade, Exness, HFM and XM
Related Articles
Sidebar rates
Related Posts
