Holding on to Our Buy Gold Signal As MAs Hold As Support
Gold has turned bullish for the last two months and we're holding on to our long term buy Gold signal as the 200 SMA holds as support

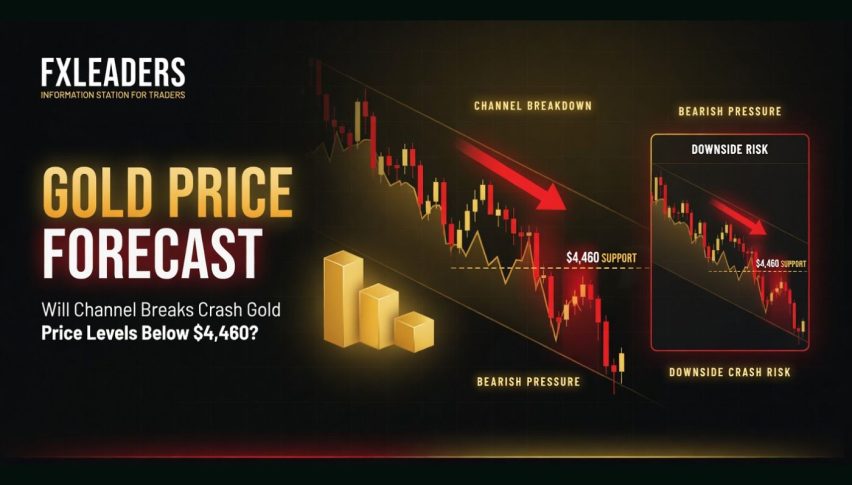
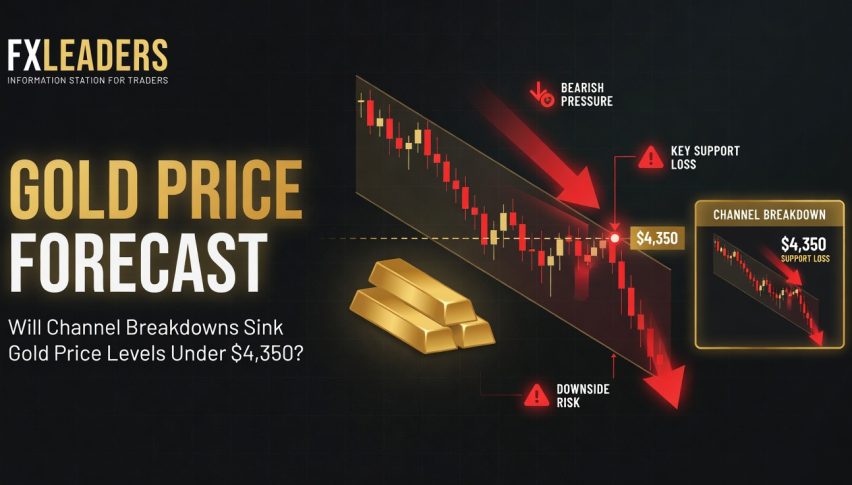
This has been a strange year for Gold, as it surges initially as a safe haven, only to lose that status and turn bearish by March. Prices are down by $250 an ounce since March highs, after central bankers stepped up their aggressive rate hikes, although it is closing the year mostly unchanged.
Gold Daily Chart – The 200 SMA Has Turned Into Support Now

Buyers remain in charge as the trend remains bullish
Although the USD weakness has helped as well during this strong bullish trend, as the Buck turned quite bearish after the FED gave signals about slowing down with rate hikes, which they already did after the 50 bps (basis points) hike early in December.
We have shifted to bullish in Gold, since the fundamentals are pointing up as well. Looking forward to 2023, the interplay between central banks continuing to intervene and economic performance/recession will be key in determining the outlook for risk sentiment, therefore Gold’s performance in 2023 will also depend on this.
Gold XAU Live Chart
- Check out our free forex signals
- Follow the top economic events on FX Leaders economic calendar
- Trade better, discover more Forex Trading Strategies
- Open a FREE Trading Account
- Read our latest reviews on: Avatrade, Exness, HFM and XM
Related Articles

Sidebar rates
Related Posts
