USD/JPY Uptrend Slows As It Approaches the 200 Daily SMA
USD/JPY has been losing the bullish momentum after making strong gains since early February and the next test is coming up
USD/JPY has been on a rollercoaster ride since early last year, surging around 40 cents higher from January until October, followed by a strong reversal after the Bank of Japan intervention, with the Ministry of Finances also helping, which sent the price to 127 lows. The USD decline added further momentum to the decline, but the USD started reversing higher early this month, and we have seen some decent gains in this pair since then.
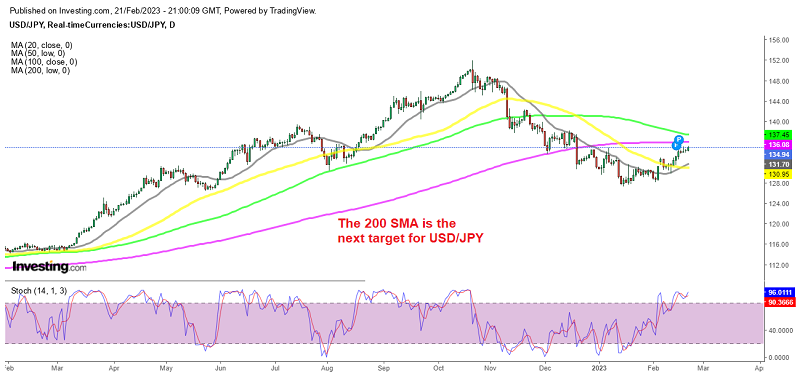
USD/JPY ran higher, peaking above 135 yesterday but retreated back below that round level, although it breached the high from last week at 135.111, along with the old topside trend line just above that level at 135.14, which confirms that buyers are still in control and the trend is bullish.
But, after reaching 135.22, the momentum faded for this pair, and the price started to rotate back lower, which means that buyers are losing momentum. So, the upside momentum is loosing steam as we approach another obstacle abpove, the 200 SMA (purple) on the daily chart. The 20 SMA (gray) was acting as resistance on this timeframe for a few months, rejecting the highs during retracing periods.
But it was broken early this month and turned into support, which is a strong sign of a bullish trend reversal. Although now we are approaching the 200 SMA which was providing support in December during the decline, so this moving average might turn into resistance.
Although, with the dvergence in the FED and BOJ policy, fundamentals point to further upside for this pair. The US economy is rebounding in Q1 after a slowdown in Q4 of last year, while the slowdown in inflation is loosing pace. FED members have become more vocal on continuing to raise interest rates, while the Bank of Japan is not making any major changes and the new governor who is coming up, will likely keep the same policy.
USD/JPY Daily Chart
- Check out our free forex signals
- Follow the top economic events on FX Leaders economic calendar
- Trade better, discover more Forex Trading Strategies
- Open a FREE Trading Account
- Read our latest reviews on: Avatrade, Exness, HFM and XM
Related Articles


Sidebar rates
Related Posts
