The 20 SMA Turns Into Support for USD/CAD As Canadian Inflation Slows
USD/CAD showing bullish signs as it reverses off the lows, while moving averages turn into support on the H4 chart
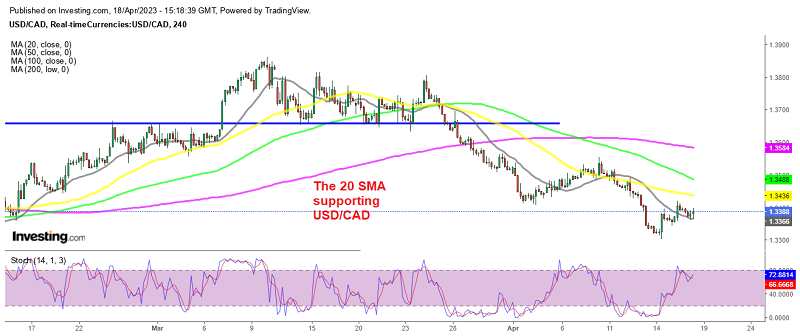
USD/CAD has been bearish for nearly a month as the USD turned softer while the CAD rallied higher on better risk sentiment and bullish Oil prices, which helped push this pair down. Although we have been seeing some bullish signals since the reversal last week. The price has climbed above the 20 SMA (green) on the H4 chart, which has turned into support now, indicating that buyers are taking charge.
Today it has been quiet and markets were waiting for the Canadian inflation report to get things moving for the Canadian Dollar, but the numbers were close to expectations, showing a slowdown in inflation. The Canadian Consumer Price Index (CPI), which measures the average price of goods and services, has started to decline rapidly.
The Bank of Canada has predicted that inflation will drop to 3% during summer. But, there is concern that the latest monthly readings still show some inflationary pressure, with two consecutive readings of +0.5% and +0.4%. If this trend were to continue, it would not add up to the 2% inflation target set by the BOC.
Details of the Canada CPI for the Month of March 2023
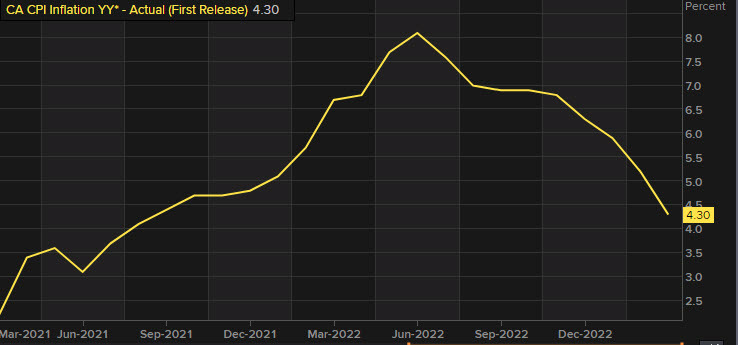
- March CPI 4.3% YoY versus 4.3% expected
- February CPI YoY was 5.2%
- March CPI MoM +0.5% vs +0.5% expected
- Prior MoM reading was +0.4%
- Gasoline prices -13.8% vs -4.7% y/y in prior (largest decline since July 2020)
- Gasoline prices -1.2% m/m vs -13.1% prior
- Food +9.7% vs +10.6% y/y prior
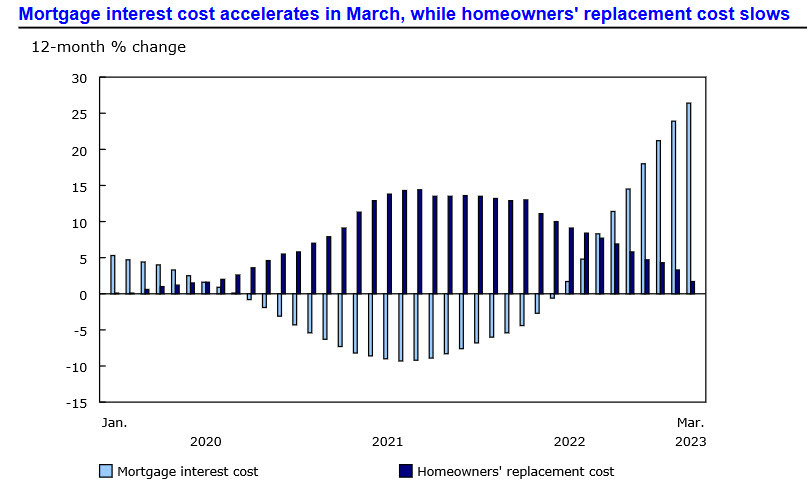
- Mortgage interest costs +26.4% y/y vs +23.9% prior
Core measures:
- BOC core CPI YoY 4.3% vs 4.4% expected (4.7% prior)
- BOC core CPI MoM +0.6% vs +0.5% prior
- Median CPI YoY 4.6% vs 4.9% prior
- Trimmed mean CPI YoY 4.4% vs 4.8% prior
- Common CPI YoY 5.9% vs 6.4% expected
CIBC notes that
“Travel tour costs posted their sharpest monthly gain on record (+36.7%) and provided the largest upward contribution to monthly CPI despite having a relatively small weight. The surge was likely driven by the timing of March break and pent-up demand for travel, and so could reverse in the coming months. Air transportation prices (+1.3%) were fairly muted in comparison.”
Main contributors to the 1-month change, not seasonally adjusted
Main upward contributors (MoM %)
- Travel tours 36.7 %
- Mortgage interest cost 2.0 %
- Purchase of passenger vehicles 1.0 %
- Electricity 3.1 %
- Gasoline 1.2 %
Main downward contributors:
- Fresh vegetables -4.0 %
- Fuel oil and other fuels -10.3 %
- Fresh fruit -3.2 %
- Telephone services -1.6 %
- Natural gas -2.4 %
USD/CAD Live Chart
- Check out our free forex signals
- Follow the top economic events on FX Leaders economic calendar
- Trade better, discover more Forex Trading Strategies
- Open a FREE Trading Account
- Read our latest reviews on: Avatrade, Exness, HFM and XM
Related Articles

Sidebar rates
Related Posts
