BTC/USD has to overcome downward pressure at $29K to test $32K
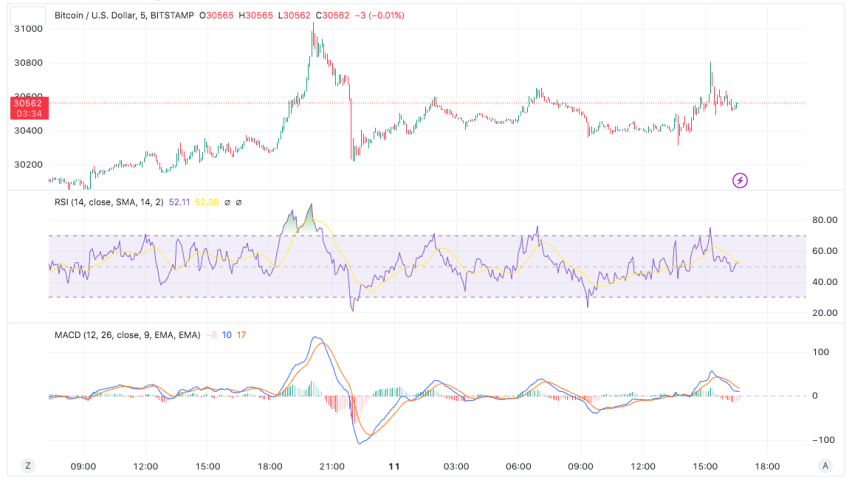
[[BTC/USD]] failed to break above $31K on Monday after a sharp dramatic price increase. The bears were so strong at this level that the price fell a while later back to $30,200 at the close of yesterday’s session. Since then, buyers have been attempting to form a demand level at $30,380, a milestone they managed and even tested $30,800 on the 4-hour time frame.
Bitcoin (BTC) is currently facing a period of uncertainty, as indicated by the mix of sell, neutral, and buy signals from various indicators and oscillators. The analysis will provide a detailed assessment of the current technical factors affecting Bitcoin’s price.
Among the indicators, 2 suggest a sell signal, 10 indicate a neutral stance and 14 points towards a buy signal. This distribution signifies a relatively balanced sentiment among market participants, with a slight inclination towards bullishness.
The oscillators provide further insight, with 2 indicating a sell signal, 9 signalling neutrality, and none suggesting a buy signal. While the majority of oscillators remain neutral, the presence of two sell signals may raise some concerns.
In terms of moving averages, none of them are indicating a sell signal, one suggests neutrality, and 14 points towards a buy signal. This indicates a positive trend overall, with a higher number of moving averages supporting a bullish outlook.
The RSI is currently at 51, which indicates a relatively balanced market sentiment. This reading suggests that Bitcoin’s price is neither overbought nor oversold, reflecting a moderate level of investor interest. The MACD is falling from 50 towards 0, currently at 7. A declining MACD suggests a weakening bullish momentum, potentially indicating a shift towards a more neutral or bearish sentiment in the short term. However, the MACD reading is still positive, suggesting that bullish momentum is not completely exhausted.
Bitcoin has been encountering resistance around the 20-day EMA, which is currently positioned at $29,854. This level is preventing buyers from consolidating sufficient strength to surpass it. The repeated inability to break above this level for several weeks has contributed to the prevailing uncertainty among both bulls and bears.
Current BTC/USD Price and Conclusion:
As of the analysis, the current price of Bitcoin is $30,572. The overall technical analysis indicates a mixed sentiment in the market, with a slight bias towards bullishness. However, the presence of sell signals from some indicators and the declining MACD suggest caution in the short term. The resistance encountered at the 20-day EMA adds to the uncertainty among market participants.
Traders and investors should closely monitor Bitcoin’s price movement, especially around the 20-day EMA. Since a break above or below this level could provide further insight into the direction of the market.
- Check out our free forex signals
- Follow the top economic events on FX Leaders economic calendar
- Trade better, discover more Forex Trading Strategies
- Open a FREE Trading Account
- Read our latest reviews on: Avatrade, Exness, HFM and XM
Related Articles

Sidebar rates
Related Posts
