USD/CHF Daily Technical Analysis: USD/CHF attempts recovery after drastic downtrend to 0.85662
The USD/CHF currency pair has been displaying an interesting price movement pattern, providing opportunities for both bulls and bears to make their mark on the market. Let’s analyze the available information and data points to understand the potential direction of the price.
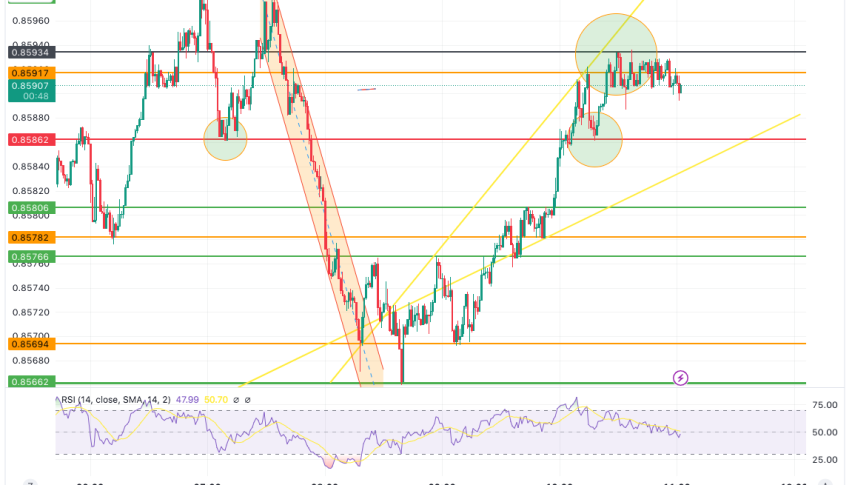
Starting with the support and resistance levels, today’s daily price floor at 0.8556 serves as a major support level. The price has tested and respected this level in the past, indicating its significance. On the upside, we have a resistance level at 0.85766, which the price managed to break after several attempts. This breakout suggests the presence of bullish momentum.
At the first retracement level of 0.85694, the price formed a double bottom pattern. This pattern often indicates a reversal of a downtrend and can act as a bullish signal. The fact that the price corrected back to this retracement level and then continued to rally further confirms the strength of the bulls. The uptrend resulted in a breakthrough of a major resistance level at 0.85880.
Moreover, the price formed a cup-with-handle pattern on the 4-hour chart, which further supports the bullish case. The completion of the handle of this pattern provided the necessary momentum for the bulls to rally strongly to 0.85934. If this trend continues, it is likely that the price will retest today’s high at 0.85979.
Analyzing the indicators, we see that there are 5 buy signals, 6 neutral signals, and 14 sell signals for the USD/CHF pair. While the sell signals indicate some bearish sentiment, the buy signals suggest a stronger presence of bullish sentiment.
Looking at the oscillators, we observe 4 buy signals, 5 neutral signals, and 2 sell signals. The presence of buy signals aligns with the potential for further bullish movement.
The moving averages provide mixed signals, with 1 buy signal, 1 neutral signal, and 12 sell signals. This indicates some conflicting views regarding the direction of the price.
MACD indicator shows a sell signal with a value of 0.00849, suggesting some bearish momentum in the market.
However, the relative strength index (RSI) provides a buy signal with a value of 21, indicating the potential for further upward movement.
If the bears take control of the momentum, there is a possibility of a retracement with a double-bottom formation at today’s price floor of 0.85662. On the other hand, if the buyers consolidate their strength, demand levels around 0.85806 and 0.85862 may act as support levels.
In the event of a deeper downtrend, the USD/CHF pair may find immediate support near the constraining zone of 0.8530, which has proven significant in the past. Further downside movement could lead to a decline towards the 0.8360 handle. If the price continues to fall, it might retest the 0.8275-0.8200 territory, where the pair previously encountered resistance in 2015 and 2011.
Considering the overall analysis, the USD/CHF pair currently displays bullish characteristics. The breakout of resistance levels, the formation of bullish patterns, and the presence of some buy signals suggest the potential for further upward movement.
Daily USD/CHF price chart
- Check out our free forex signals
- Follow the top economic events on FX Leaders economic calendar
- Trade better, discover more Forex Trading Strategies
- Open a FREE Trading Account
- Read our latest reviews on: Avatrade, Exness, HFM and XM
Related Articles


Sidebar rates
Related Posts
