Bearish Sign in EUR/USD After Failing to Hold on Above 1.10 Again
This week, EUR/USD gained momentum, breaking over the important 1.1000 barrier. Following the European Central Bank's (ECB) expected...
This week, EUR/USD gained momentum, breaking over the important 1.1000 barrier. Following the European Central Bank’s (ECB) expected decision to keep interest rates unchanged, the Euro drew buyer interest, pushing the EUR/USD pair higher, but once again, buyers couldn’t keep the gains above that major level.
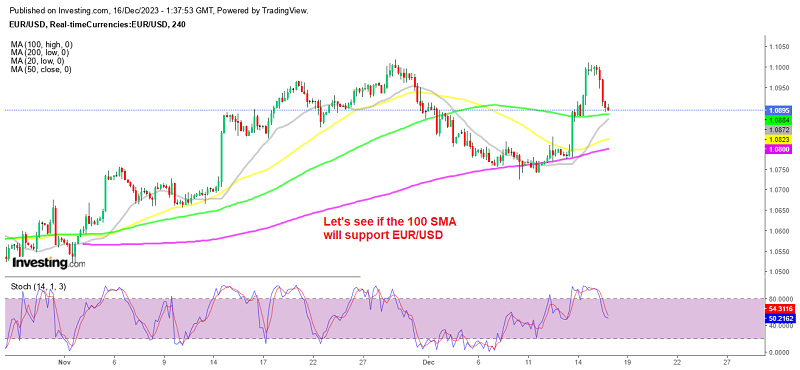
EUR/USD H4 Chart – Will the 100 SMA Hold as Support?

The ECB’s decision to keep key rates constant, with the main refinancing operations remaining at 4.50%, the marginal lending facility remaining at 4.75%, and the deposit facility remaining at 4.00%. In contrast to some market expectations for rate cuts, the ECB stressed the importance of maintaining high borrowing rates, citing persistent price pressures despite a drop in inflation estimates.
However, stronger economic numbers from the United States (US) and a weaker business activity from the Eurozone killed the bullish momentum. As a result, this pair fell below 1.09 on Friday. The data is not supporting the hawkish outlook by the ECB, so buyers got cold feet right away and they gave up as soon as they pushed above 1.10. The highs reached on Thursday after the ECB meeting was 1.10 before reversing, around the same zone where the high from late November comes at.
On the other hand, industrial production in the United States increased by 0.2% MoM, from -0.9% in the previous month. The Services PMI report on Friday also indicated that the US economy is in good shape, despite the US central bank tightening by 500 bps in the last two years. Besides that, New York Fed President John Williams stated on Friday that it would be “premature” to discuss rate decreases at the March meeting, raising the US 2-year Treasury note rate by six basis points to 4.449%.although the US Treasury yields ended up down for another week.
Now, the picture in EUR/USD is pointing to a double top pattern on the daily chart, which should send this pair to 1.04 lows if it works out. The neckline is around 300 pips lower from the double top, so the decline should be around 600 pips lower from the top. Although, we will see how the price action reacts early next week and if Friday’s selling pressure will continue.
EUR/USD Live Chart
- Check out our free forex signals
- Follow the top economic events on FX Leaders economic calendar
- Trade better, discover more Forex Trading Strategies
- Open a FREE Trading Account
- Read our latest reviews on: Avatrade, Exness, HFM and XM
Related Articles
Sidebar rates
Related Posts
