VeChain Rises by Over 17%: Healthcare Focus, Partnerships, and Analyst Predictions Fuel Rally
VeChain (VET) has surged over 17% in the past 24 hours. This bullish climb follows several positive developments, attracting investor

VeChain (VET) has surged over 17% in the past 24 hours. This bullish climb follows several positive developments, attracting investor attention and potentially marking a turning point for the blockchain platform. Let’s unpack the key reasons behind this price jump:
1. Deepening Commitment to Healthcare Innovation
VeChain’s renewed partnership with DNV GL and Renji Hospital for the Digital Intelligent Cloud Tumor Center highlights its long-term commitment to blockchain-powered healthcare solutions. This seven-year collaboration showcases successful implementation and paves the way for future use cases.
2. Potential Regulatory Compliance Benefits
DNV GL’s involvement, a reputable risk management firm, brings trust and potential regulatory compliance advantages to VeChain’s solutions. Aligning with China’s blockchain adoption plans might attract wider institutional adoption.
3. VeChain Price Prediction by Prominent Analyst
Technical analyst Ali Martinez’s prediction of a potential 1,900% gain for VET by year-end has captured attention, though caution is advised due to the speculative nature of such forecasts.
4. Broader Crypto Market Sentiment
Despite a lack of significant gains across the board, a cautious sense of optimism in the market might have contributed to opportunistic investment in VET’s perceived potential.
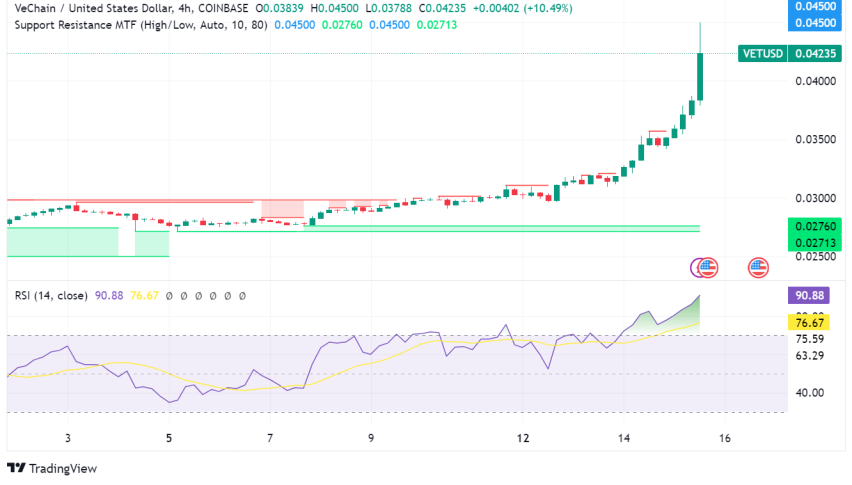
VeChain (VET/USD) Technical Analysis
VET has seen a significant surge in the past 24 hours, rising over 16%. This follows a period of sideways movement and consolidation after a previous rally.
Key Indicators:
- Moving Averages: The 50-day and 200-day moving averages are currently flat, suggesting indecision in the market. However, a recent crossover of the shorter-term (e.g., 10-day) moving average above the longer-term one could indicate bullish momentum.
- Relative Strength Index (RSI): The RSI is currently around 76, indicating overbought conditions and potential for a pullback.
- Support and Resistance Levels: Key support levels lie around $0.030 and $0.025, while resistance levels are near $0.038 and $0.045. Breaching these levels decisively could indicate further movement in that direction.
- Check out our free forex signals
- Follow the top economic events on FX Leaders economic calendar
- Trade better, discover more Forex Trading Strategies
- Open a FREE Trading Account
- Read our latest reviews on: Avatrade, Exness, HFM and XM