USD/MXN: Mexican Peso Has a Wild Day, up 8.8% After Israeli Attack & Down 5% During London Hours
The Israeli attack overnight drove risk-off sentiment that sent the Mexican peso to a day high of 18.56. The flight from risk didn’t last an


The Israeli attack overnight drove risk-off sentiment that sent the Mexican peso to a day low of 18.56. The flight from risk didn’t last and fundamentals took over again throughout the day sending the dollar down to 17.15 during the European session.
With geopolitical risk taking a back seat the market received the Retail Sales figures for Mexico. The numbers were sharply higher than previously at 0.4% MoM compared to -0.6%, and 3% YoY compared to -0.8%.
The expanding consumer activity helped send the Mexican peso to current levels as traders went back to the fundamentals of this FX pair. The next monetary policy meeting for Banxico is on May 9 and we’re expecting them to hold rates steady at 11%.
While the Fed is looking more likely to leave rates at current levels of 5.25-5.50% until Q4 this year. The spread may favor the Mexican peso initially, however, Banxico has a lot more action to take. Most forecasts see the Mexican central bank rate at 8.5-9.5% by year’s end.
The interest rate differential is likely to favor the dollar again as we get closer to Q4. Economic data from both countries will set the outlook for this FX pair as we get closer to both banks’ monetary goals.
Technical View
The day chart below for USD/MXN shows how the correction that started 8 sessions ago attempted to break through the Ichimoku cloud. This event would have signaled the possibility of a new bull trend taking place.
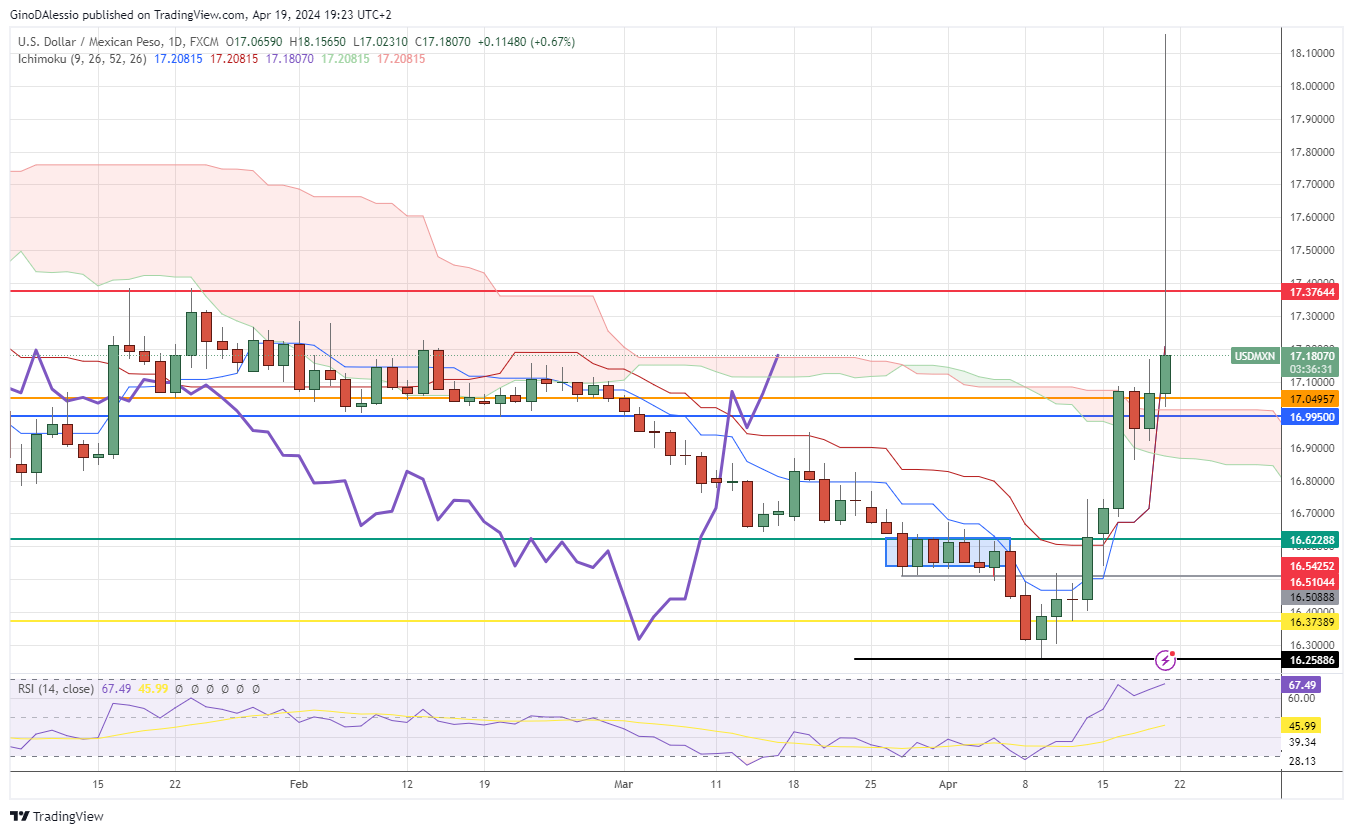
However, for the bullish signal to be complete we need the lagging line (purple line) to clear the cloud and then another close above the cloud with Monday’s candle. Considering the current formation of today’s candle that seems the least likely outcome.
The RSI is also very close to 70, which isn’t in overbought territory yet. But in an ongoing bear trend it can be more than enough to get the market to turn south again. If a correction lower takes place the market will find support from the cloud and the level between 17.03 (orange line) and 16.99 Blue line).
Thes two levels were set in April 2016 and September 2023, respectively. A close below the cloud should take the market lower, where it would find support at 16.62 (green line). While a continued run higher would find resistance at 17.37 (red line).
- Check out our free forex signals
- Follow the top economic events on FX Leaders economic calendar
- Trade better, discover more Forex Trading Strategies
- Open a FREE Trading Account
- Read our latest reviews on: Avatrade, Exness, HFM and XM
Related Articles


Sidebar rates
Related Posts
