Staying Short on NZDUSD As Downtrend Picks Up Pace
The USD to NZD rate was trading in a 1-cent range for months, but last week NZD/USD made a break to the downside, turning our bias bearish.
The USD to NZD rate was trading in a 1-cent range for months, but last week NZD/USD made a break to the downside, turning our bias bearish. The weak recovery in China has been weighing on the Kiwi recently, while the failure of the FED to commit to a date regarding the first rate cut, is keeping the USD supported.
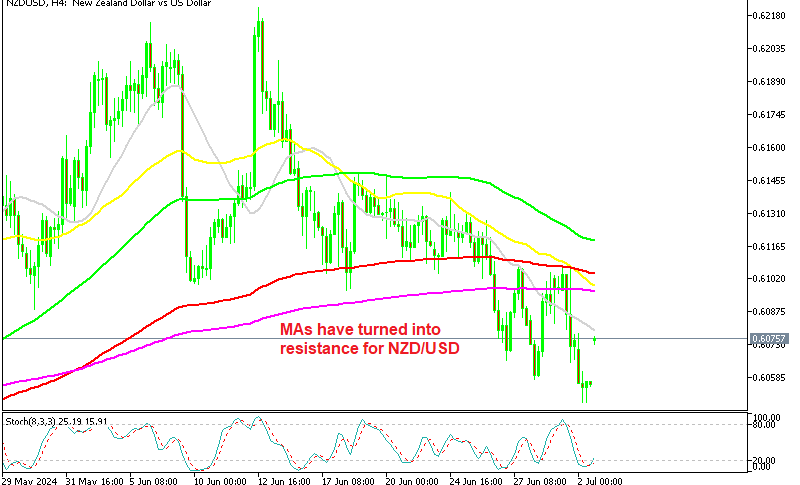
NZD/USD Chart H4 – MAs have turned Into Resistance
Examining the H4 chart, the NZD/USD has repeatedly rebounded from the consolidation zone around the key support level of 0.61. Buyers have consistently entered at this juncture, pushing the price upward. Nonetheless, last week saw a shift in market dynamics as sellers seized control, driving the market below this crucial level and breaking through the 0.61 mark. This move has intensified bearish momentum, setting the stage for a potential decline toward the 0.60 zone. If this bearish trend persists, we could see further downward pressure as the market adjusts to the new lower levels.
Yesterday we had the GDT price index and whole milk powder which showed a considerable decline. This significant fall is a setback for New Zealand’s terms of trade. However, despite the negative data, the NZD remained largely unchanged, suggesting market participants might be factoring in other positive economic indicators or anticipating future stability in dairy prices.
New Zealand GDT Price Index:
- GDT Price Index: -6.9%
- Whole Milk Powder: -4.3%
- Average Price: $3,782 per metric ton
Last night, we also had the ANZ Commodity Prices from New Zealand.
NZD/USD Live Chart
- Check out our free forex signals
- Follow the top economic events on FX Leaders economic calendar
- Trade better, discover more Forex Trading Strategies
- Open a FREE Trading Account
- Read our latest reviews on: Avatrade, Exness, HFM and XM