Ethereum Is Down 27%, Traders Upbeat: Will ETH Bulls Build From $2,800?
Ethereum tumbled last week, crashing to worrying level. However, now ETH is finding footing. Will bulls build on from $2,800?
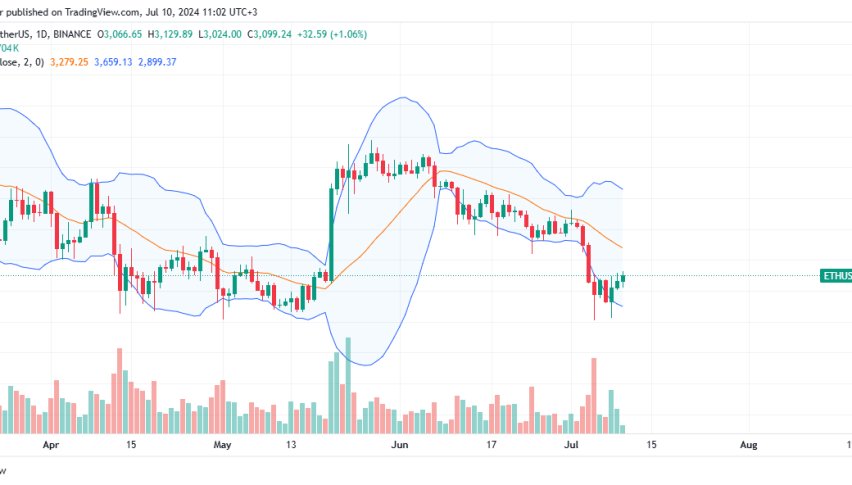
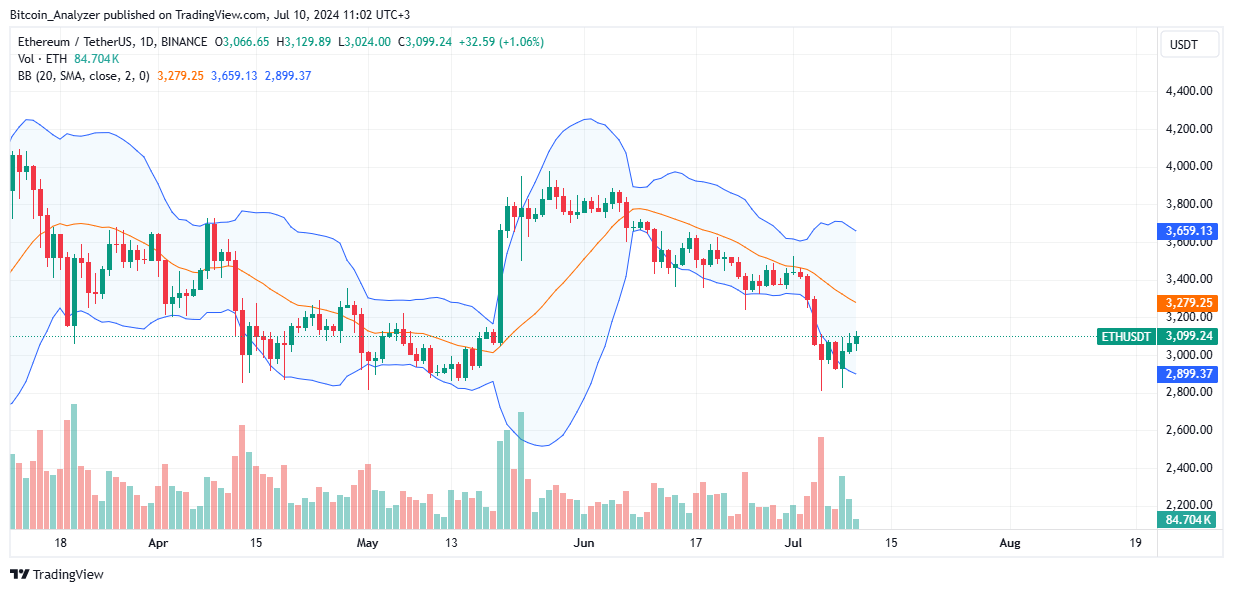
Ethereum, mirroring the general state of crypto, is choppy. Prices are moving horizontally over the last few trading days after the bounce higher over the weekend. From the daily chart, the $3,000 level is crucial. However, if buyers have to take over, a decisive close above $3,100 and $3,300 is necessary. For now, traders should watch price action keenly, noting that Ethereum is still bearish. Notably, the short-term trend is defined by the sell-off of early July.
At press time, Ethereum is in red, dropping by 27% from May highs. Losses of July confirm the impact of June. If there is a recoil lower, pushing prices below $3,000 by the end of the day, there will be more sell-off. For now, ETH is up 1% in the past day and down 8% week-to-date. The problem is that the sideways movement means most traders stay on the sidelines. The average trading volume in the past 24 hours stood at just $14 million.
Traders are closely monitoring the following Ethereum news:
- Though it might be days before a spot Ethereum ETF hits the market, sentiment is at the lowest point in 2024. The negative sentiment primarily stems from the state of price action and the inability of bulls to extend gains of late May.
- As of July 10, all spot Ethereum ETF applicants have filed and submitted updated S-1 registration forms with the United States SEC. This means that the derivative product will hit the market within days.
Ethereum Price Analysis
There is nothing major to take home regarding ETH/USD price performance.
Losses of last week took the coin back to May lows, solidifying the importance of $2,800 as a support level.
If buyers are to take charge, the line must hold. Any confirmation of the July 4 and 5 bears, which could see ETH plunge towards $2,500, is a bearish breakout formation.
Technically, bulls still have a chance. However, for trend definition, a close above $3,900 is necessary.
Before then, fundamental factors, primarily the imminent trading of spot ETFs, provide tailwinds.
Conservative traders can wait on the sidelines for a breakout above or below this range before committing.
A rally above $3,900 opens ETH to $4,100 and $4,500 in the medium term.
- Check out our free forex signals
- Follow the top economic events on FX Leaders economic calendar
- Trade better, discover more Forex Trading Strategies
- Open a FREE Trading Account
- Read our latest reviews on: Avatrade, Exness, HFM and XM
Related Articles


Sidebar rates
Related Posts
