Crude Oil Crashes Below the 200 Daily SMA
Crude Oil was bullish in June, but have turned bearish in July, falling below $77 after consolidating above $80 for several weeks.

Crude Oil was bullish in June, but have turned bearish in July, falling below $77 after consolidating above $80 for several weeks. The price fell below the 200 daily SMA yesterday, which had been acting as resistance before, so it might turn into resistance once again and a good place to sell Oil.
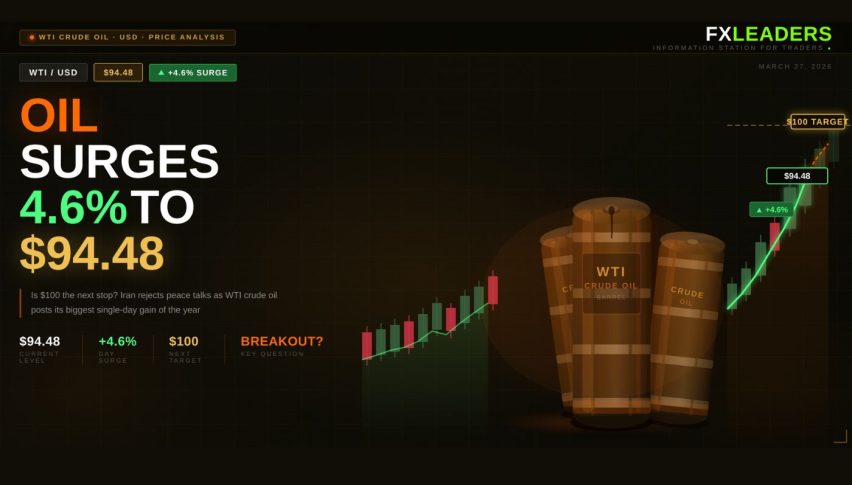
Friday witnessed a significant drop in crude oil prices, declining over 3% as global economic worries overshadowed fresh concerns about lower Q3 supplies. Although the political landscape remains uncertain, Trump’s policies are expected to be expansionary and inflationary, potentially leading to a slower pace of FED rate reductions, which could negatively impact oil prices.
WTI Crude Oil Chart Daily – The 200 SMA Has Been Finally Broken

In June, oil prices surged by more than $10, peaking at $84. However, they reversed course in early July, falling below $80 last week. This week has commenced on a somber note, with prices anticipated to dip into the mid-$70s. Friday’s market activity suggests a potential downward trend in oil prices as the global economy continues to struggle.
API Crude Oil Inventories Report
Headline Crude Oil Inventories
- Decreased by 1.6 million barrels
- Expectations: Decrease of 1.6 million barrels
Distillates
- Decreased by 1.5 million barrels
- Expectations: Increase of 0.2 million barrels
Gasoline
- Decreased by 2.8 million barrels
- Expectations: Decrease of 0.4 million barrels
Cushing
- Decreased by 1.6 million barrels
Strategic Petroleum Reserve (SPR)
- Increased by 0.7 million barrels
US WTI Crude Oil Live Chart
- Check out our free forex signals
- Follow the top economic events on FX Leaders economic calendar
- Trade better, discover more Forex Trading Strategies
- Open a FREE Trading Account
- Read our latest reviews on: Avatrade, Exness, HFM and XM
Related Articles
Sidebar rates
Related Posts
