NIKKEI225: Loses 12.4% – Largest Drop Since 1987 Black Monday
Asia stocks suffer the risk-off sentiment after drop in jobs in the U.S. on Friday. Recession fears overtake the Fed monetary loosening stan

Asia stocks suffer the risk-off sentiment after drop in jobs in the U.S. on Friday. Recession fears overtake the Fed monetary loosening stance.
The NIKKEI225 suffered its worst one-day drop, losing over 4,400 points at one point today. The last Fed meeting left the market clear on the central bank’s position, and a rate cut seems very likely for September.
But contrary to what has happened in the recent past, when the market rallied on dovish Fed policy, the market realized there’s a greater risk. The latest GDP readings suggest an economy that is accelerating more slowly, and the job data is backing it up.
Fears of a recession in the U.S. are taking hold of the market, and Friday’s sell-off has spilled over to this week’s open. Japan stocks are also battling with a hawkish BoJ, the hike of 0.25% was expected by many but not entirely anticipated from forward guidance.
There are more hikes expected in the last quarter of 2024. The latest concerns from many government officials of the undesired effects of a weak yen play a big part. The last hike came after various calls to protect the yen.
A weak yen dents private consumption and puts pressure on food and energy prices. The BoJ’s mandate is to contain inflation, but as we have seen a weak yen is also of concern for the central bank.
Technical View
The day chart below for the NIKKEI225 shows a market in a fully bearish trend. The last 3 candles all have a large day range and long candle bodies, which show the strength of the recent sell-off.
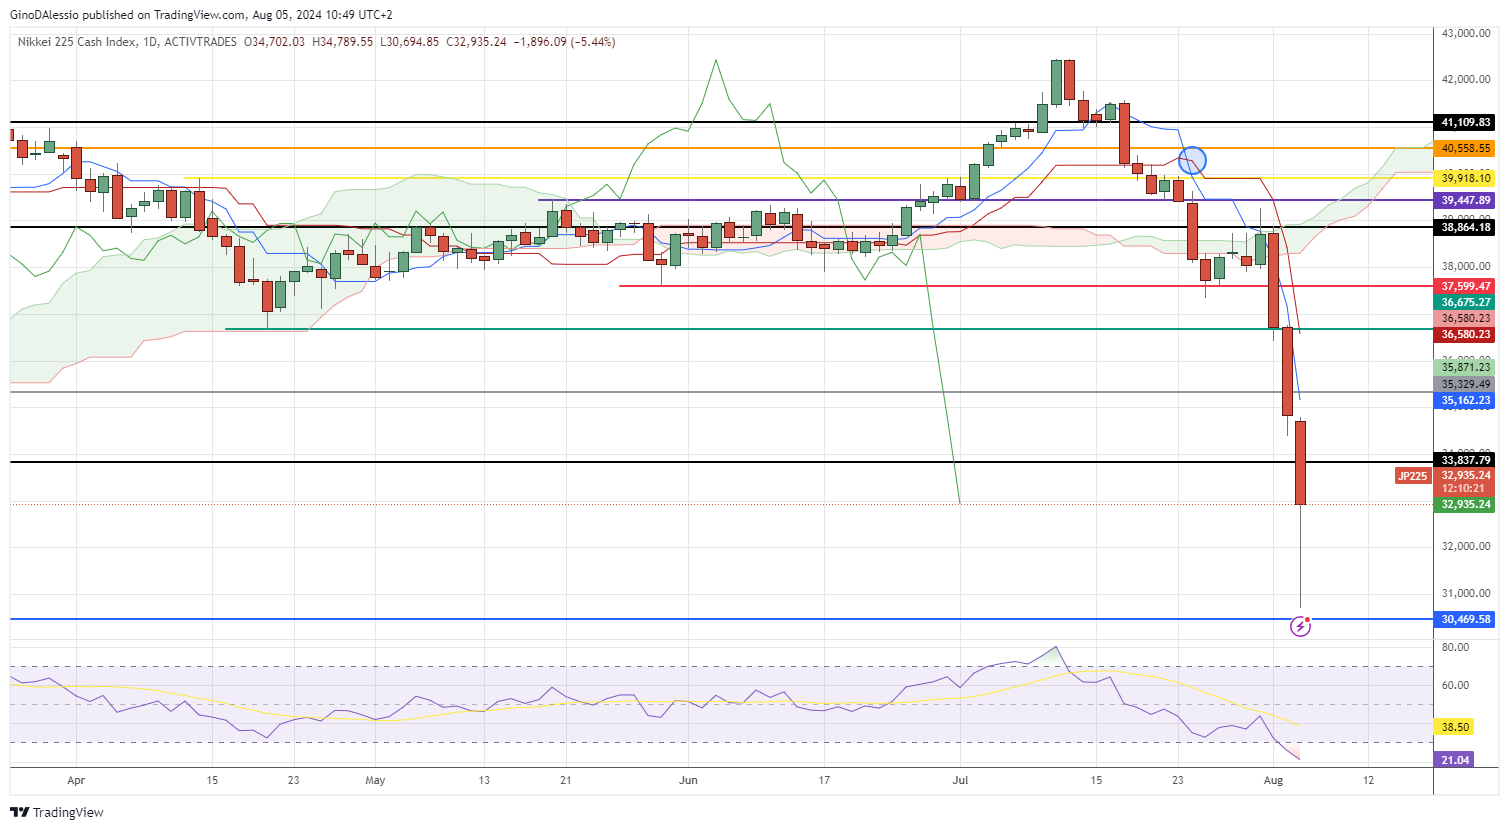
Today’s candle has found support on a previous low of 30,469 (blue line). Which corresponds to a dip back in October 2023. We can see that the RSI has reached a very oversold level today of 20.94.
An RSI below 30 also indicates that that the market has a strong momentum. However, should the RSI close above 30, we can expect some correction in the market given the oversold levels. The market will find the next resistance at 33,837 (black line).
Should that level break, the market will find the next resistance area at 35,329 (grey line).
- Check out our free forex signals
- Follow the top economic events on FX Leaders economic calendar
- Trade better, discover more Forex Trading Strategies
- Open a FREE Trading Account
- Read our latest reviews on: Avatrade, Exness, HFM and XM
Related Articles


Sidebar rates
Related Posts
