Spot Ethereum ETFs Post Inflows: Enough to Push ETH Above $2,800?
Ethereum is firm, building on yesterday's gains. For now, there are inflows into spot ETFs but resistance remains at $2,800
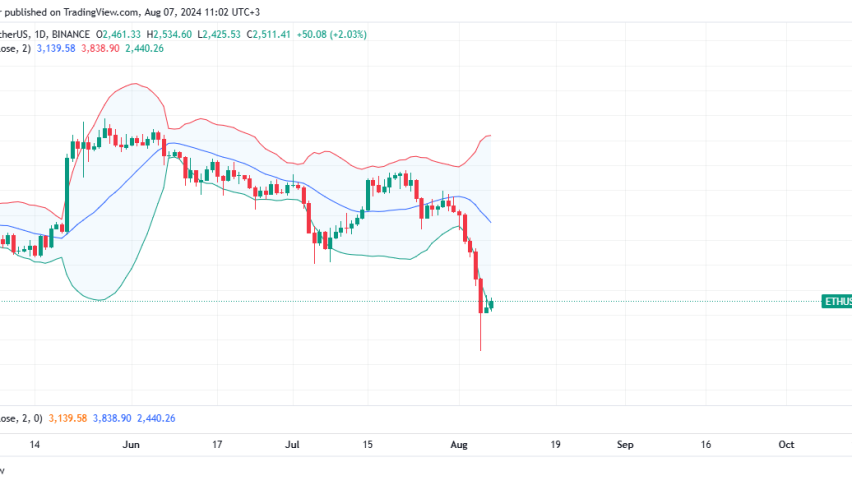
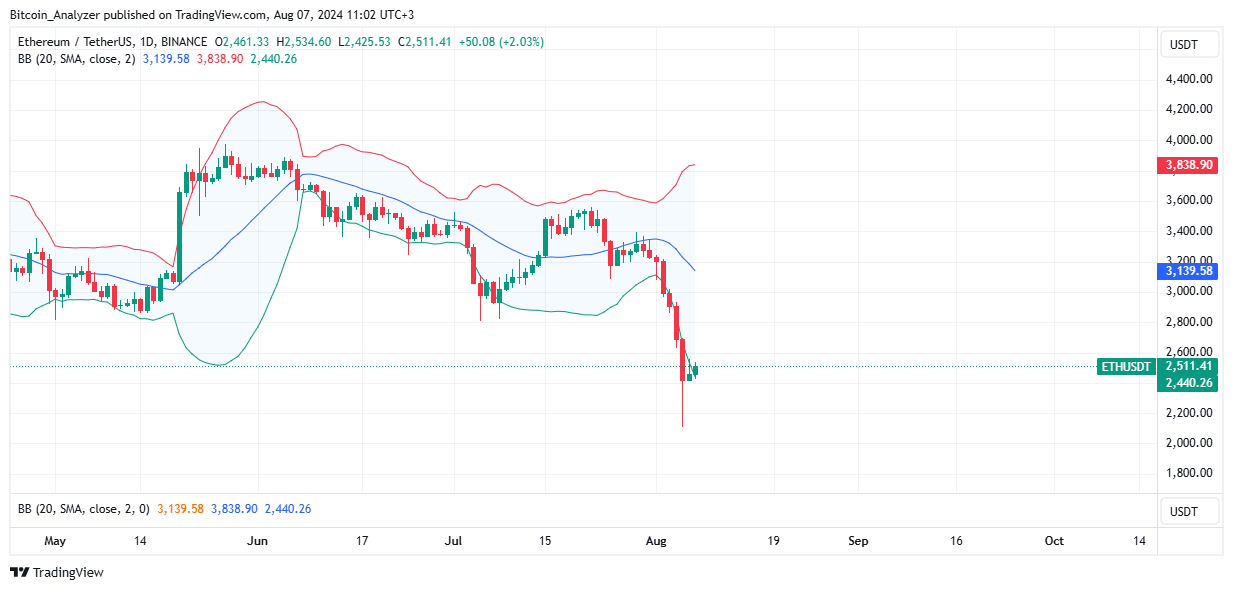
Ethereum, mirroring the performance across the crypto board, bounced higher yesterday. Nonetheless, this is not to say buyers are back and the selling pressure from August 5 has been contained. If anything, bears are in control, and the immediate local resistance remains at $2,800, at least for now. In the coming days, traders should closely monitor what happens between this level and $2,000. Sparks of demand will be mainly fundamentally driven, with a specific focus on inflows to spot ETFs.
The short-term favors sellers and aggressive traders will take this position. Prices remain in a narrow range, boxed within a wide-ranging bear bar of August 5. At spot rates, ETH is down nearly 40% from May highs. However, yesterday’s recovery reduced weekly losses to around 25%. Still, participation is dropping, reaching over $24 billion in the past day.
The following Ethereum news developments are trending:
- Eyes are on spot inflows. By August 5, despite the sharp drop, inflows stood at over $48 billion even when ETHE saw nearly $47 million in outflows. Demand for ETH was evident across BlackRock and VanEck offerings.
- Analysts are convinced after the deleveraging on August 5. Then, over $400 million of ETH leveraged positions were stopped, signaling a possible bottom. If this is the case, a brief consolidation could form the basis of a leg up.
Ethereum Price Analysis
ETH/USD is bearish when writing.
While there is recovery, traders await a conclusive close above the $2,500 and $2,800 resistance levels before committing to long.
In that case, the immediate target would be $3,300.
However, if yesterday’s gains are reverse and Ethereum closes in the red today, ETH might slip below $2,000 to as low as $1,800 in a bear trend continuation formation.
Notice that prices are still inside the wide-ranging bear bar of August 5. This favors sellers from a top-down preview now that the August 6 bar was narrow and with even lower trading volume.
- Check out our free forex signals
- Follow the top economic events on FX Leaders economic calendar
- Trade better, discover more Forex Trading Strategies
- Open a FREE Trading Account
- Read our latest reviews on: Avatrade, Exness, HFM and XM
Related Articles


Sidebar rates
Related Posts
