Bitcoin Nears $100K as Trump’s UK Trade Deal Sparks 3% Price Surge
Bitcoin (BTC/USD) has hit $99,411, just shy of the $100,000 mark after former US President Donald Trump posted on social media.
Quick overview
- Bitcoin has surged to $99,411, nearing the $100,000 mark, following Donald Trump's hint at a significant trade deal with the UK.
- The Federal Reserve maintained interest rates, creating a favorable environment for alternative assets like Bitcoin amid economic uncertainty.
- Traders have reacted positively to Trump's announcement, with Bitcoin rising 1.7% in less than 24 hours and shorts liquidated totaling $96 million.
- Bitcoin is currently testing a key resistance level at $99,919, with potential for further gains if it breaks above this threshold.
Bitcoin (BTC/USD) has hit $99,411, just shy of the $100,000 mark after former US President Donald Trump posted on social media. He hinted at a big trade deal with the UK, which will be announced on May 8th. According to The New York Times, three sources confirmed the UK as the partner in the upcoming agreement, which could be a big shift in global trade.
The Fed kept interest rates at 4.25%–4.50% despite Trump’s pressure for cuts to boost the economy. The Fed’s decision has created a good environment for alternative assets like Bitcoin which tends to do well in times of monetary uncertainty.
Traders React to Political Catalysts
Bitcoin’s move up is directly linked to Trump’s trade announcement, from $97,759 to $99,411 in less than 24 hours according to CoinMarketCap. 1.7% up and now Bitcoin is close to the $100,000 mark, last tested in February 2025.
Crypto analyst Charlie Sherry said “Markets move in the opposite direction of consensus. Everyone was bearish and now the sentiment has flipped”. Neil Jacobs, co-founder of FOMO21 said on X (formerly Twitter) that Bitcoin’s move up is “directly tied to Trump’s announcement”.
Key Points:
-
Current Bitcoin price: $99,411
-
All-time high: $109,000 (Jan 20)
-
Shorts liquidated in 24 hrs: $96 million
-
Fear & Greed Index: 65 (Greed)
Technical Analysis – Key Resistance Ahead
Bitcoin is testing the resistance zone at $99,919, which is a long term descending trendline. The break above the 50-day SMA at $95,793 has boosted the bullish sentiment but the RSI is close to 70, overbought.
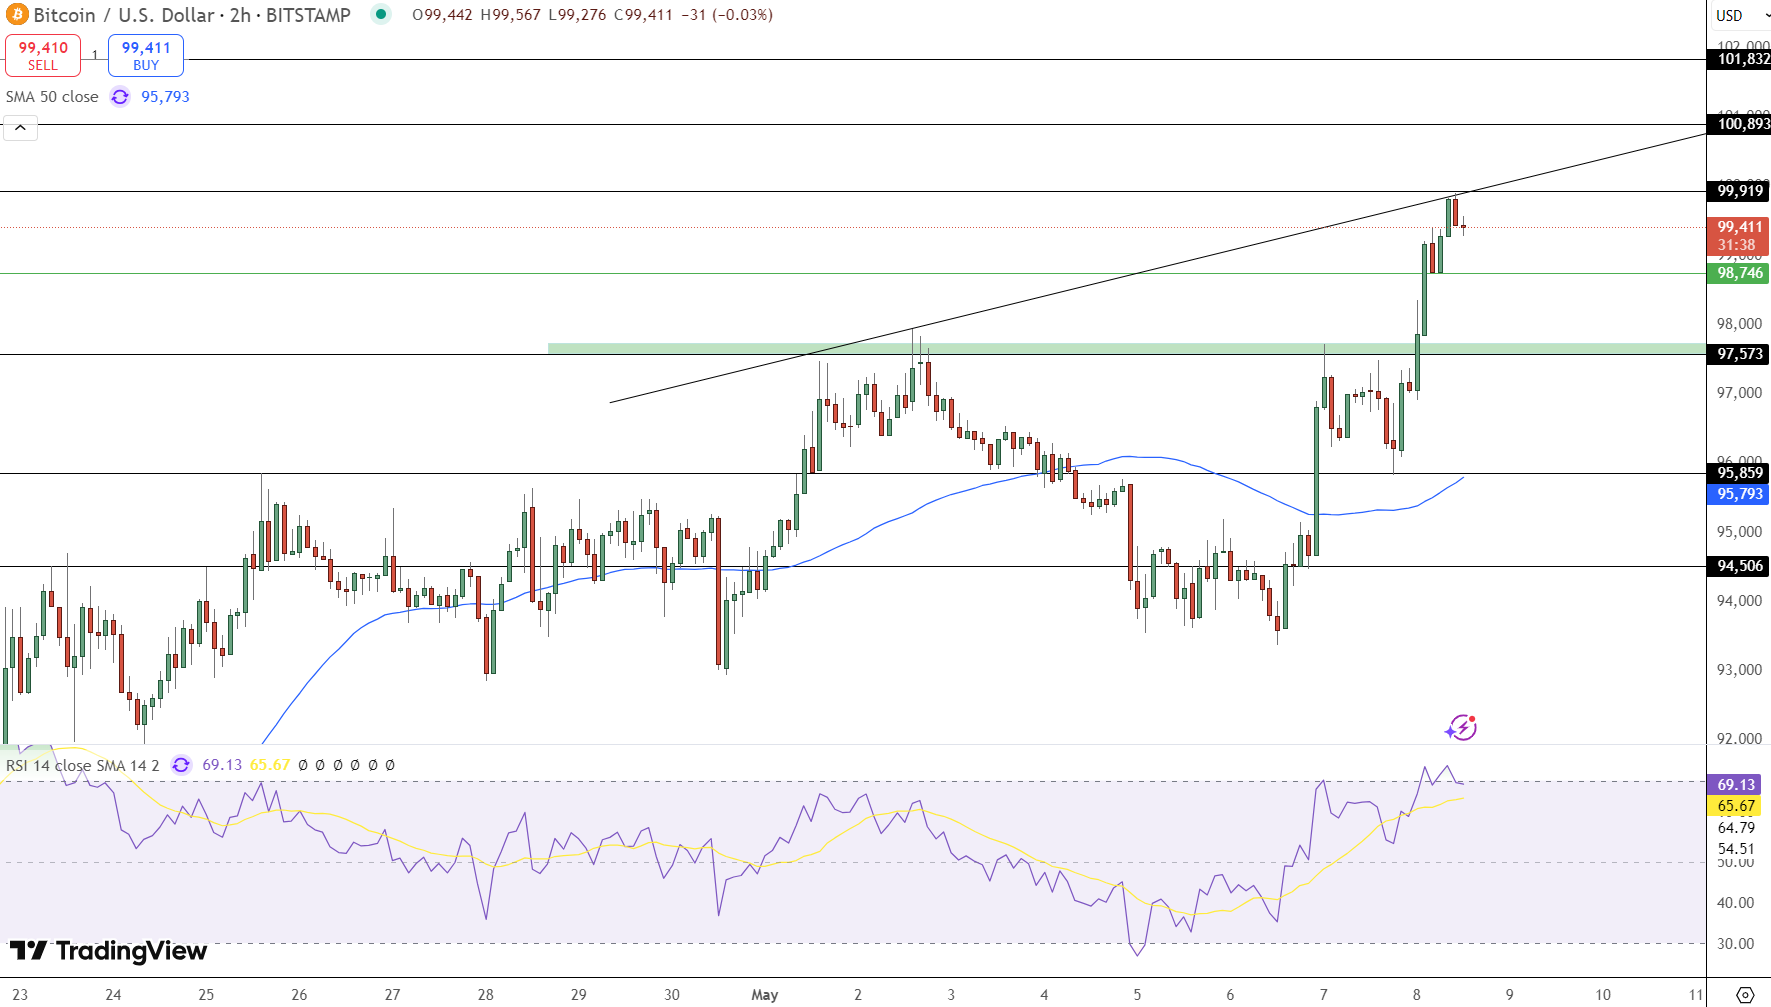
A clean break above $99,919 could take us to the next resistance at $100,893 and a new all-time high. But if this momentum fails to hold we could see a pullback to $98,746 or even $95,793 if selling intensifies.
Trade Setup:
-
Buy Above: $99,919 (on close)
-
Take Profit: $100,893
-
Stop Loss: $98,746
This is a breakout trade while managing risk if BTC doesn’t clear the resistance, good for short-term traders.
- Check out our free forex signals
- Follow the top economic events on FX Leaders economic calendar
- Trade better, discover more Forex Trading Strategies
- Open a FREE Trading Account
- Read our latest reviews on: Avatrade, Exness, HFM and XM
Related Articles
Sidebar rates
