Ethereum Price Prediction: Bullish Triangle Targets $6,000 – Key Levels to Watch
Ethereum (ETH) is trading at $2,485 after a big move up from the $1,788 low earlier this month. According to Peter Brandt...
Quick overview
- Ethereum (ETH) has risen to $2,485 from a low of $1,788, indicating potential for a significant breakout.
- Analyst Peter Brandt identifies a bullish symmetrical triangle pattern, suggesting ETH could reach $6,000 if it surpasses resistance at $2,850 to $2,900.
- On-chain metrics show increased whale accumulation and institutional interest, bolstered by BlackRock's ETH ETF filing and Brazil's plans for ETH futures.
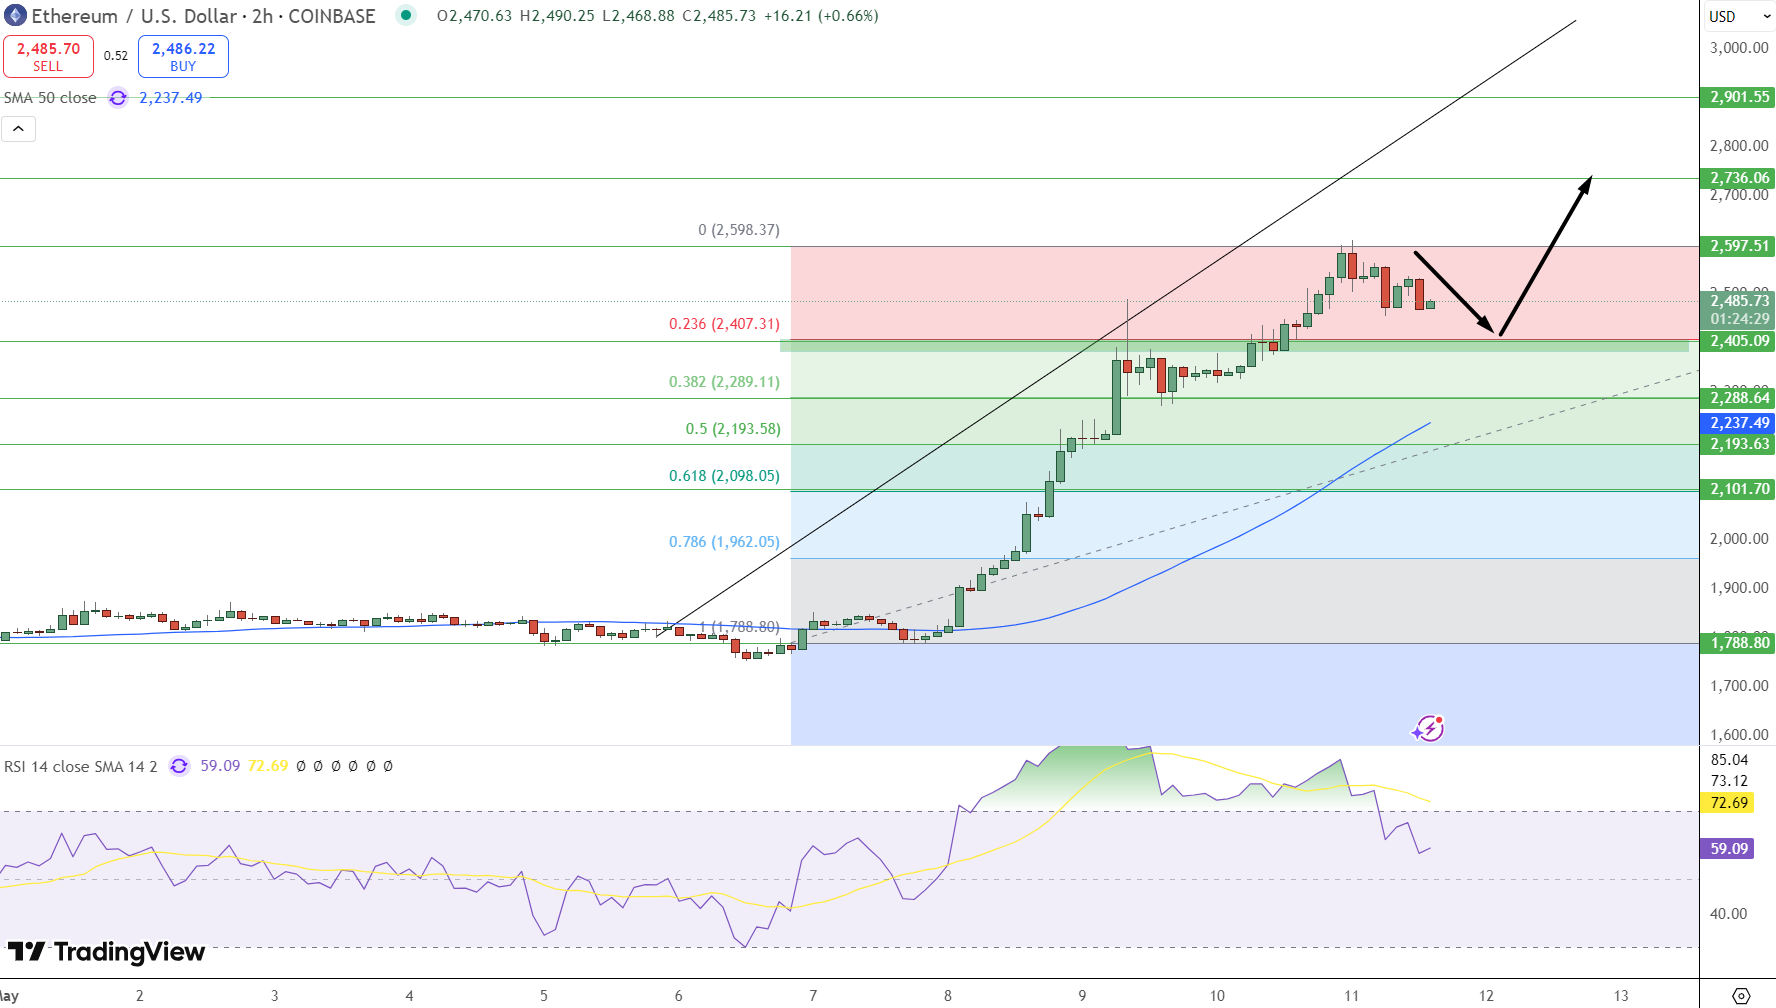
- Key support levels to watch are $2,407 and $2,289, while resistance levels are at $2,598 and $2,736.
Ethereum (ETH) is trading at $2,485 after a big move up from the $1,788 low earlier this month. According to Peter Brandt, this could be the start of a big breakout with ETH potentially going to $6,000 if it clears key resistance. Brandt is known for his long term price predictions and points to a symmetrical triangle on Ethereum’s monthly chart as a bullish sign.
Ethereum’s Bullish Triangle Breakout
Brandt’s analysis shows a symmetrical triangle pattern which is a bullish continuation signal. This pattern has been forming since 2021 with resistance at $2,850 to $2,900. If ETH can break above this zone the technicals suggest a quick move to $5,600 or $6,000 which is 140% from current levels.
Recent price action supports this. ETH bounced off the 23.6% Fib level at $2,407 a key short term support after a big move up from the $1,788 low. If it holds above this level it could retest the $2,598 resistance the recent high and potentially go to $2,736. But if it fails to hold this level it could pull back to the 38.2% Fib level at $2,289 which is close to the 50-SMA at $2,237.
On-Chain Metrics and Institutional Interest
Adding to the bullish case on-chain data shows big whale accumulation. The largest ETH inflow since 2017 suggests institutional interest is growing with big holders positioning themselves for a breakout. BlackRock’s recent filing for an ETH ETF with staking and Brazil’s plan to list ETH futures in June also adds to the long term bullish case.
These institutional moves are big because they provide more investment vehicles for large scale investors to get into ETH potentially driving the price up. If these trends continue ETH could see a move similar to its 2021 bull run.
Key Levels to Watch
-
Immediate Support: $2,407 (23.6% Fib level)
-
Next Support: $2,289 (38.2% Fib level, near 50-SMA)
-
Immediate Resistance: $2,598 (recent high)
-
Next Resistance: $2,736 (extension target)
-
Major Resistance: $2,850 to $2,900 (triangle level)
Trade:
-
Buy Above: $2,407
-
Take Profit: $2,598 – $2,736
-
Stop Loss: $2,289
Setup: Buy above $2,407, target the $2,598 high, with a stretch target of $2,736. Stop below $2,289 to manage risk, if it breaks below this level it could be a deeper correction.
Summary
With a symmetrical triangle and big whale accumulation Ethereum’s technical and fundamental look good. A break above $2,850 could be a big move to $6,000 but be careful, if it breaks below $2,289 it could be a deeper pullback.
- Check out our free forex signals
- Follow the top economic events on FX Leaders economic calendar
- Trade better, discover more Forex Trading Strategies
- Open a FREE Trading Account
- Read our latest reviews on: Avatrade, Exness, HFM and XM
Related Articles
Sidebar rates
