DAX Hits New All-Time High after US-China Trade Deal Promise
China and the US met in Switzerland over the weekend, and what delegates have announced is that there is a deal, but no details.
Quick overview
- China and the US reached a trade deal during their meeting in Switzerland, but specific details remain undisclosed.
- The announcement has led to a surge in global markets, with the DAX hitting a new all-time high.
- High expectations for the deal may not be fully met, as the current tariffs leave significant room for negotiation.
- The DAX's bullish trend is confirmed by technical indicators, although caution is advised due to potential RSI concerns.
Live DAX Chart

China and the US met in Switzerland over the weekend, and what delegates have announced is that there is a deal, but no details.
- Joint statement expected later Monday on tariff specific
- High expectations could cause disappointment
- Technicals break final bull trend barrier
The DAX rallied on today’s open to a new ATH, gaining 1.79% at one point before retracing lower.
US-China Trade Deal
Delegations from China and the US met in Switzerland over the weekend to discuss a trade deal.
The representatives have not so far disclosed the details but have stated that an agreement has been reached.
Expectations were high before the weekend meeting and the announcement of a deal has pushed global markets higher.
The DAX has leapt to a new ATH at 23,911, while the FTSE has gained 0.50% and the CAC 0.78%, US markets did even better, the NAS100 jumping 3.44% and the DOW 1.84%.
DAX companies rely heavily on exports, and the news of a trade deal paves the way for an EU trade deal next.
High Expectations Likely Not Met
The market is clearly pricing in something similar to a free trade deal. I find it hard to believe that the US would allow underpriced Chinese goods to enter the US so easily.
The fact that the tariffs in place stand at 145% leaves a lot of room for maneuvering. And China would probably be content with low tariffs compared to the current exorbitant rate.
How that would translate for investors I find hard to gauge, but certainly it cannot be as positive for the markets as a free trade deal.
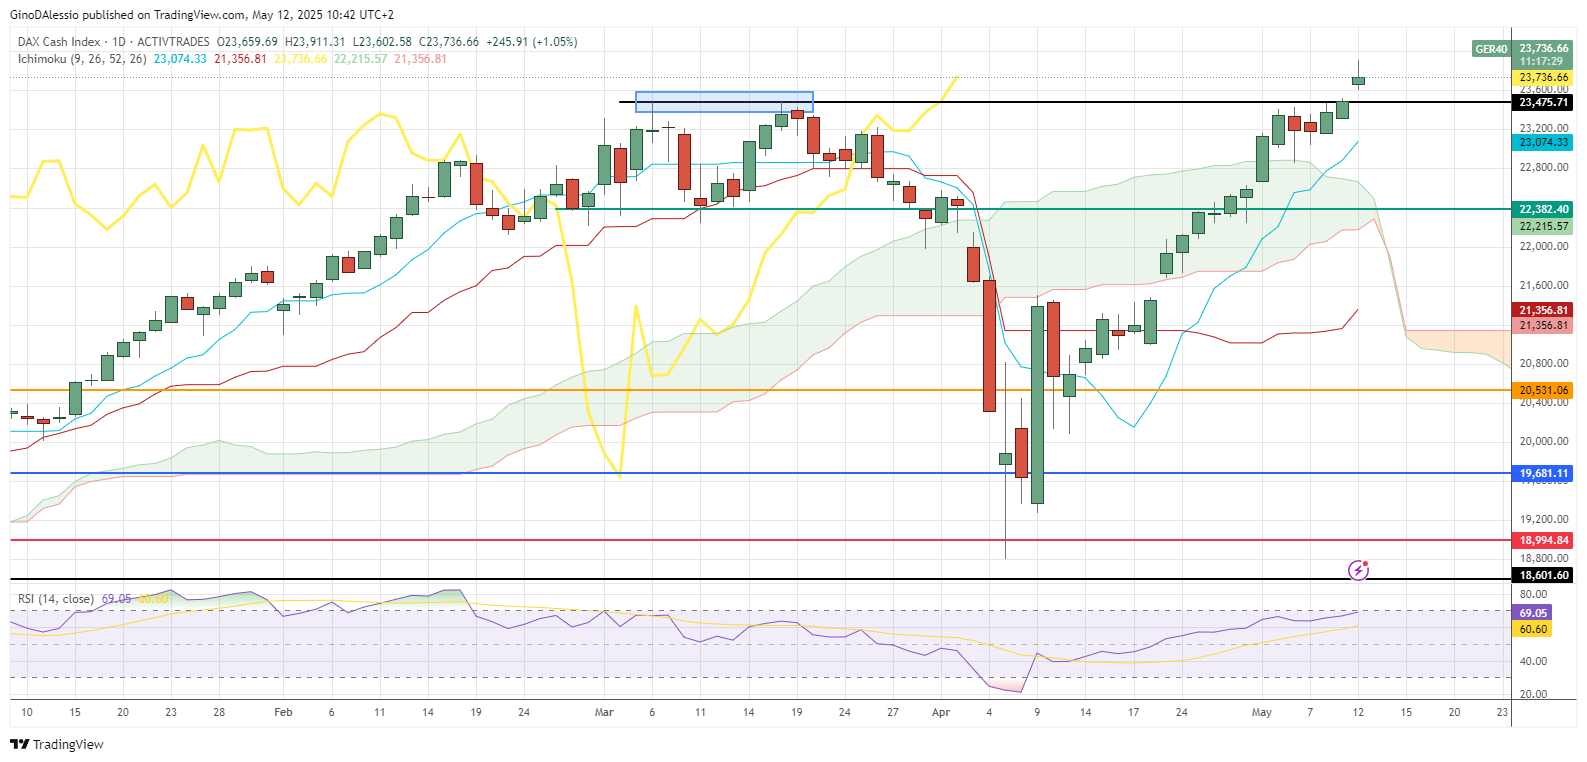
DAX Daily Chart
Technical View
The daily chart above for DAX shows a market that has completed all the triggers to indicate a bull trend.
Prices are above the Ichimoku cloud, with the lagging line (yellow line) also above the cloud. The last hurdle was the previous ATH, which was touched twice and created a double top (blue area).
Today’s candle has traded well above that double top area, completing the indications of an ongoing bull trend.
The only danger I see is from the RSI, which should close above the level of 70 to indicate strong bullish momentum.
- Check out our free forex signals
- Follow the top economic events on FX Leaders economic calendar
- Trade better, discover more Forex Trading Strategies
- Open a FREE Trading Account
- Read our latest reviews on: Avatrade, Exness, HFM and XM
Related Articles
Sidebar rates
