Dogecoin Targets 89% Rally as Adam & Eve Pattern and Whale Buys Fuel $1.08 Dream
Dogecoin (DOGE) is trading at $0.2192, down 4.54% in the last 24 hours, with a market cap of $32.75 billion and $1.39 billion in trading...
Quick overview
- Dogecoin (DOGE) is currently trading at $0.2192, down 4.54% in the last 24 hours, with a market cap of $32.75 billion.
- An Adam & Eve double bottom pattern on the weekly chart suggests a potential bullish breakout target of $1.08.
- Whale accumulation has increased, with wallets holding 100 million to 1 billion DOGE adding 3.61 billion DOGE since January 2025.
- Short-term charts indicate bearish signals, with critical support levels at $0.2173 and $0.2110.
Dogecoin (DOGE) is trading at $0.2192, down 4.54% in the last 24 hours, with a market cap of $32.75 billion and $1.39 billion in trading volume. Despite the recent dip, technical and on-chain signals suggest DOGE may be gearing up for a big move.
Adam & Eve Pattern Suggests Bullish Breakout
On the weekly chart DOGE is forming a rare and powerful Adam & Eve double bottom pattern, which could see DOGE surge to $1.08—a level not seen since 2021’s crypto craze. The pattern’s rounded Eve bottom formed throughout 2022, followed by the sharp V-shaped Adam pattern in early 2025. With the neckline at $0.56958 and the lowest trough at $0.058, the projected breakout target is ~89%.
Key points:
-
Breakout target: $1.08 (pattern depth + neckline)
-
Support: Strong support at current $0.228 zone
-
Trigger: Break above $0.56958 neckline
This is similar to past crypto breakouts like Solana’s October 2024 move from $140 to $160 after forming a similar pattern.
Whales Accumulating
Behind the scenes big players are buying. Since January 2025 wallets holding 100 million to 1 billion DOGE have added 3.61 billion DOGE. Buying during consolidations is a bullish sign that whales are positioning for the next move.
On-chain data:
-
Whale accumulation: 3.61B DOGE added since January 2025
-
Buying during dips: Historically a bullish indicator
If history repeats, this combination of technical and on-chain signals could be the setup for a big move.
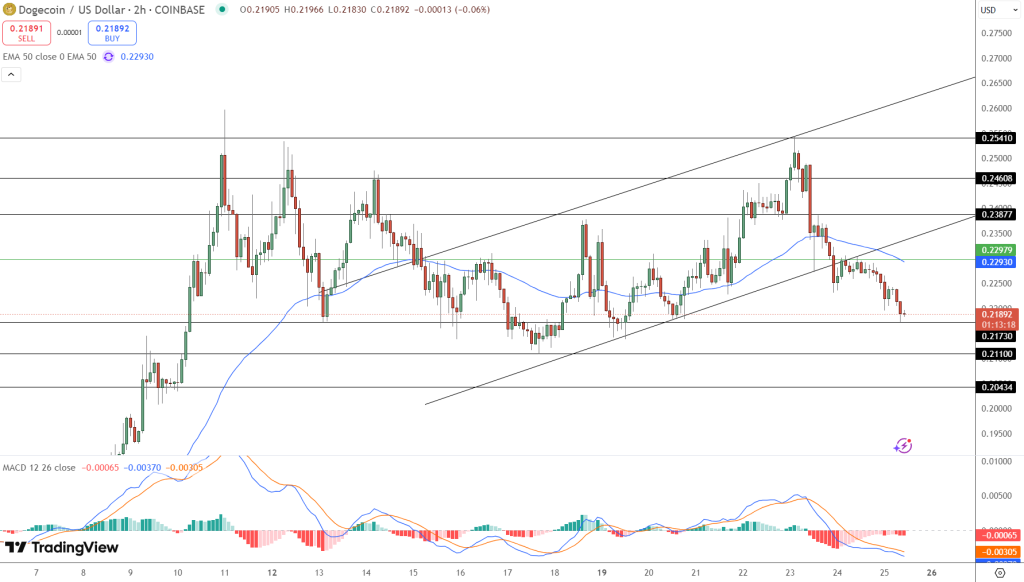
Short Term Chart Caution
On the 2-hour chart DOGE has broken below the mid-term channel and the 50-period EMA at $0.2293, short term bearish. Price action is rejecting at $0.2388–$0.2461 and support is at $0.2173 and $0.2110. The MACD is bearish and lower highs.
For traders:
-
Break below $0.2173 for potential drop to $0.2110
-
Above $0.2293 for momentum shift and $0.2388
-
Look for reversal signals like a bullish engulfing candle or a narrowing MACD histogram.
- Check out our free forex signals
- Follow the top economic events on FX Leaders economic calendar
- Trade better, discover more Forex Trading Strategies
- Open a FREE Trading Account
- Read our latest reviews on: Avatrade, Exness, HFM and XM
Related Articles


Sidebar rates
Related Posts
