Bitcoin Consolidates Above $105K: MicroStrategy Signals Fresh Acquisition Amid Technical Divergence Warnings
Bitcoin maintains its position above the crucial $105,000 threshold with modest 1% daily gains, as institutional accumulation continues
Quick overview
- Bitcoin remains above $105,000 with a modest daily gain of 1%, despite bearish technical signals suggesting a potential pullback.
- MicroStrategy continues its aggressive Bitcoin accumulation, adding 4,020 BTC recently, bringing its total holdings to 580,250 BTC.
- Technical analysis indicates a bearish divergence in momentum, with potential retracement levels identified at $97,000 and $90,000.
- Analysts maintain a long-term bullish outlook for Bitcoin, targeting $340,000 by the end of 2025, provided it holds support above $91,000-$100,000.
Bitcoin BTC/USD maintains its position above the crucial $105,000 threshold with modest 1% daily gains, as institutional accumulation continues despite emerging bearish technical signals that could trigger a pullback to key support levels.
MicroStrategy’s Relentless Accumulation Strategy Reshapes Market Dynamics
Once more indicating an upcoming Bitcoin purchase, MicroStrategy co-founder Michael Saylor marks the company’s eighth consecutive week of BTC acquisitions during their most recent buying frenzy. With its most recent acquisition on May 26, the corporate behemoth added 4,020 BTC valued around $427 million to their treasury, therefore increasing their total holdings to an unheard-of 580,250 BTC.
Since September 2020, this enormous build-up of unrealized capital gains surpassing $20 billion has resulted in a return on the company’s Bitcoin investment strategy of over 50%. MicroStrategy is currently the biggest known institutional Bitcoin holder in the world, according to data from Bitcoin Treasuries, having more Bitcoin than the US and Chinese governments taken together.
But market players have taken close examination at the company’s openness policies. MicroStrategy’s lack of consistent proof-of-reserves audits raises concerns among critics who some of them seek specific evidence of the claimed Bitcoin holdings. Saylor argues in favor of this strategy since such audits expose wallet addresses to possible threat actors, therefore compromising security for big companies.
BTC/USD Technical Analysis Reveals Bearish Divergence Despite Bullish Structure
The technical scene of Bitcoin shows a mixed picture as the coin tries to keep its positive course. While RSI data on weekly timeframes shows a worrying bearish divergence that would indicate declining momentum, popular trader Matthew Hyland has found a “pivotal” weekly closing level.
The relative strength index divergence implies that although Bitcoin’s price levels have been high, the underlying purchasing demand could be declining. If selling pressure rises, Trader Titan of Crypto has underlined fair value gaps at $97,000 and $90,000, therefore indicating possible retracing objectives.
The general structure of the market stays encouraging even with the bearish technical indicators. With a level of support at $84,000, the bull market helps to offer significant negative protection. Furthermore, trader CrypNuevo points out that the $100,000 level marks a powerful psychological barrier where liquidity usually gathers, maybe acting as a price magnet during any decline.
Long-Term Bullish Outlook Targets $340,000 Despite Near-Term Volatility
Analyst Plan D has found a three-year cup-and-handle pattern indicating Bitcoin might hit $340,000 before the end of 2025 despite near-term volatility. As long as Bitcoin keeps support above the $91,000-$100,000 zone, this positive structure stays relevant. Following a period of consolidation and then a breakout above $76,000 in November 2024, the pattern shows Bitcoin’s recovery from its previous all-time high crash in 2021.
With the recent correction acting as a healthy pullback rather than a trend reversal, the present price action points Bitcoin as in the early phases of a significant rally. Still, this hopeful picture hinges mostly on keeping support above important technological thresholds.
Bitcoin Price Prediction and Key Levels to Watch
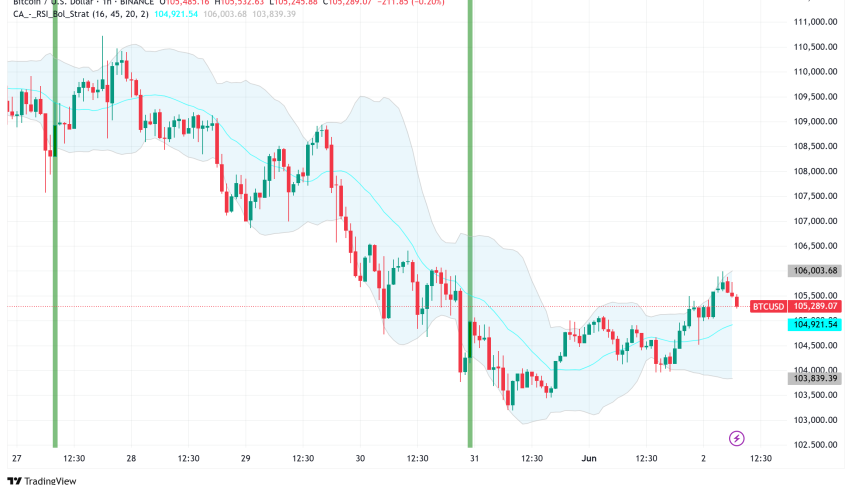
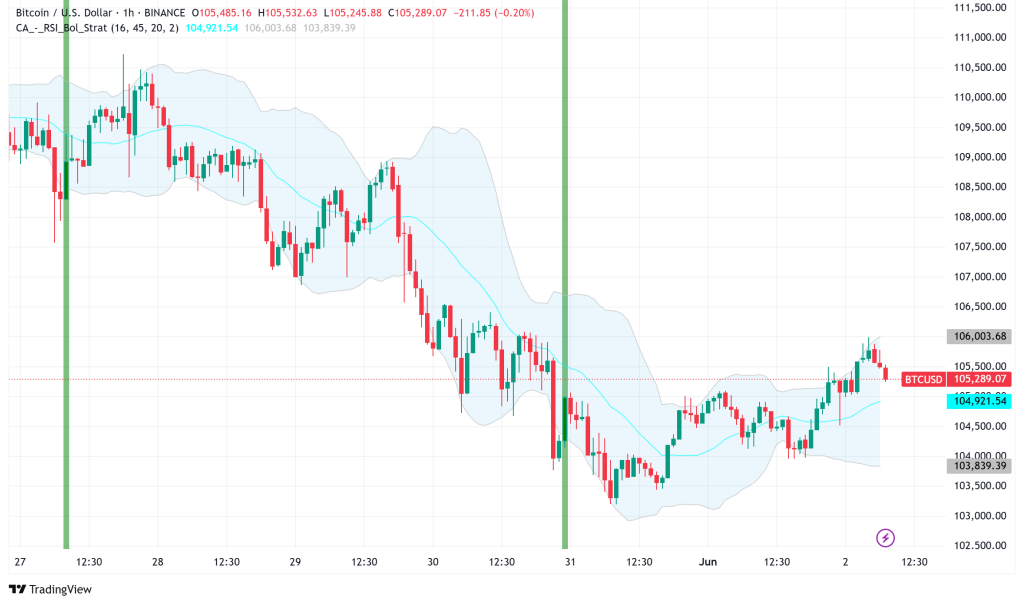
The immediate price motion of Bitcoin encounters opposition at the 20-day exponential moving average at $105,232. Ignoring this level could set off a fall toward the psychologically relevant $100,000 support. Technical indications point to a possible range-bound period when the RSI is close to the midpoint and the 20-day EMA shows flattening tendencies.
Bitcoin has to break above $111,980 if it is to reach the next significant resistance at $130,000 and show optimistic continuation. On the other hand, a breach below $100,000 might hasten selling toward $93,000, where more robust support is expected to show.
The 4-hour chart shows moving averages turning negative, which somewhat benefits sellers. Key support levels to keep an eye on are $103,000 and $100,000; resistance comes at $106,000 and $106,800.
- Check out our free forex signals
- Follow the top economic events on FX Leaders economic calendar
- Trade better, discover more Forex Trading Strategies
- Open a FREE Trading Account
- Read our latest reviews on: Avatrade, Exness, HFM and XM
Related Articles


Sidebar rates
Related Posts
