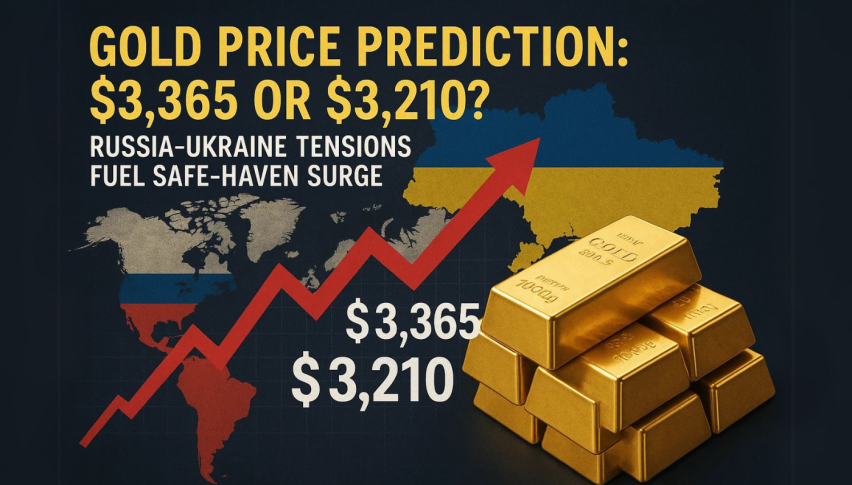
Gold Price Prediction: $3,365 or $3,210? Russia-Ukraine Tensions Fuel Safe-Haven Surge
Gold is up 0.37% to $3,326 as geopolitical and trade risks resurface. US President Donald Trump’s threat to double tariffs on steel...
Quick overview
- Gold prices have increased by 0.37% to $3,326 due to rising geopolitical and trade risks.
- US President Trump's tariff threats have raised concerns, prompting warnings of retaliation from the European Commission.
- Market analysts suggest that a softer US dollar is making gold more attractive to overseas buyers.
- Traders are advised to wait for a confirmed price movement before making any decisions, as gold is currently in a tight trading range.
Gold is up 0.37% to $3,326 as geopolitical and trade risks resurface. US President Donald Trump’s threat to double tariffs on steel and aluminum to 50% has caused concern. The European Commission has responded warning of retaliation. Meanwhile Ukraine has launched bold strikes and Russia has retaliated with overnight drone attacks.
“Trade and geopolitical worries are bubbling to the surface again so no surprise to see gold ticking higher to start the week,” said Tim Waterer, chief market analyst at KCM Trade.
A softer US dollar is also helping gold. The dollar index is down 0.1% making gold cheaper for overseas buyers.
Fed and Tariff Headlines to Watch
Markets are waiting for guidance from US Federal Reserve officials this week. Fed Chair Jerome Powell is speaking later today and could provide clues on the monetary policy outlook. Fed Governor Christopher Waller said interest rate cuts could be possible this year despite short term price spikes from the proposed tariffs.
Trump is due to speak with China’s Xi Jinping soon about trade issues including the dispute over critical minerals so the macro backdrop is uncertain—keeping gold in focus for investors.
Gold Technical: Ready to Break or Bounce?
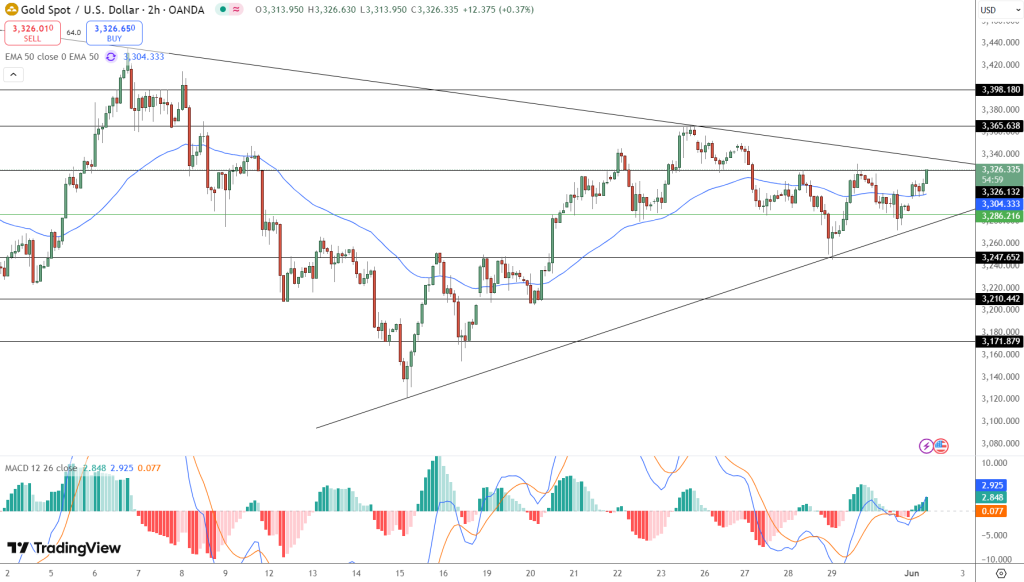
On the 2 hour chart gold is coiling in a symmetrical triangle between $3,365.6 and $3,286.2. The 50 period EMA at $3,304 is the pivot and MACD is hinting at a bullish crossover. If gold breaks above $3,365.6 especially with a strong bullish candle or three white soldiers pattern, it could go to $3,398.1 or higher. A drop below $3,286.2 could see it fall to $3,247.6 or $3,210.4.
Key levels:
-
Support: $3,286.2, $3,247.6, $3,210.4
-
Resistance: $3,365.6, $3,398.1
So for traders the plan is simple: wait for a confirmed break or breakdown with volume and candlestick confirmation before getting in. Until then, sit tight as gold tightens up—big moves in either direction.
- Check out our free forex signals
- Follow the top economic events on FX Leaders economic calendar
- Trade better, discover more Forex Trading Strategies
- Open a FREE Trading Account
- Read our latest reviews on: Avatrade, Exness, HFM and XM