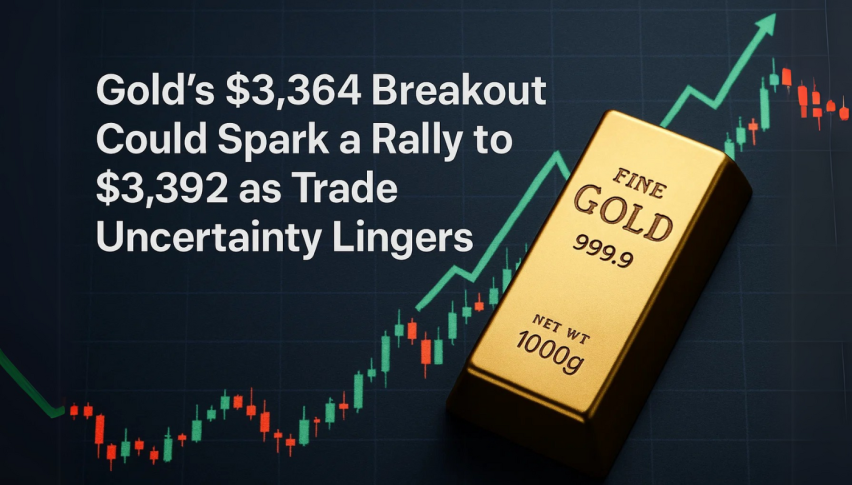
Gold’s $3,364 Breakout Could Spark a Rally to $3,392 as Trade Uncertainty Lingers
Gold dips as dollar recovers from 6-week low, but trade uncertainty remains Gold prices fell on Tuesday as the US dollar recovered...
Quick overview
- Gold prices declined as the US dollar rebounded from a six-week low, with the Dollar Index rising to around 98.90.
- Despite the pullback, demand for gold remains strong due to ongoing trade uncertainties between the US and China.
- Gold is currently consolidating above $3,346, showing signs of strength with bullish technical indicators.
- Traders are advised to look for breakout opportunities above $3,364, targeting levels between $3,392 and $3,414.
Gold dips as dollar recovers from 6-week low, but trade uncertainty remains
Gold prices fell on Tuesday as the US dollar recovered from a six-week low. The Dollar Index (.DXY) rose slightly to hover near 98.90. While the dollar’s rebound capped gold’s upside, underlying demand remains.
“Gold’s pullback is in line with the dollar’s bounce—still, demand is intact,” said Brian Lan of GoldSilver Central in Singapore. On Monday, gold rose 2.7% – its biggest daily gain in over three weeks. Gold is consolidating above $3,346 – near the 38.2% Fibonacci retracement – which is a sign of strength.
Trade Uncertainty Remains
Investors are still cautious as US-China trade tensions show no signs of easing. President Trump’s threat to double tariffs on steel and aluminum imports from 25% to 50% has sparked fears of retaliation. The European Commission is also planning to push back with potential countermeasures. The White House confirmed Trump and China’s Xi Jinping will speak this week, adding more uncertainty.
This backdrop keeps safe-haven demand for gold strong as traders expect volatility in equity and currency markets.
Gold’s Technicals Point to Breakout
Gold is consolidating in a rising channel with higher lows and an EMA crossover – 50-period EMA above the 200-period EMA – which is bullish. The spinning top candle at $3,346 shows indecision but also a potential reversal higher.
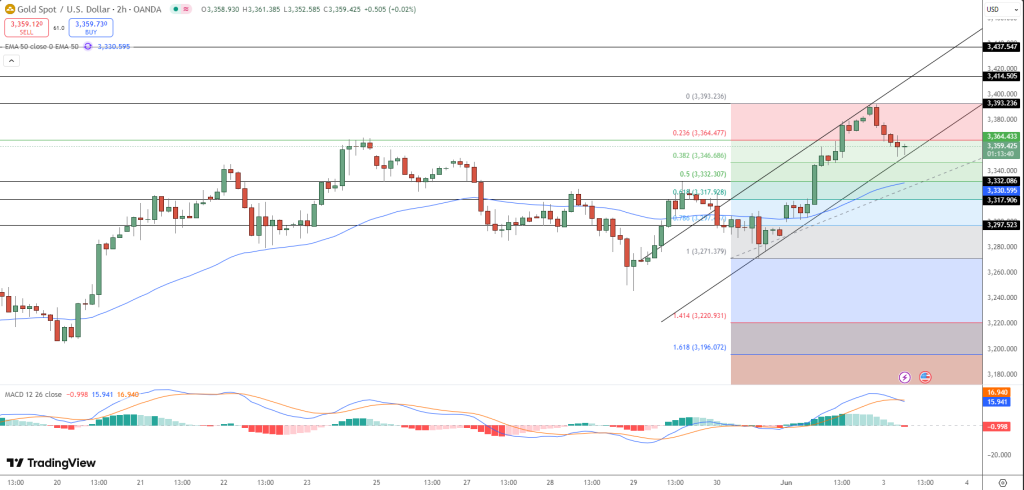
The MACD histogram is fading and a bullish MACD crossover is imminent. A close above $3,364 – which is the 23.6% Fibonacci level – could trigger a test of $3,392 or $3,414 – the channel’s upper boundary.
For new traders:
-
Entry: Long on breakout above $3,364
-
Target: $3,392–$3,414
-
Stop: Below $3,332
Look for bullish candlestick patterns like engulfing or morning stars for confirmation. Be cautious if reversal patterns like three black crows or shooting stars appear as these could be a change in momentum.
- Check out our free forex signals
- Follow the top economic events on FX Leaders economic calendar
- Trade better, discover more Forex Trading Strategies
- Open a FREE Trading Account
- Read our latest reviews on: Avatrade, Exness, HFM and XM
Related Articles


Sidebar rates
Related Posts
