Ethereum ETFs Score $109.5M in 12 Days—ETHA Surges 45% Amid Whale Moves
Ethereum ETFs are on fire—literally. Over the last 12 trading days, institutional investors have put in $109.5 million into Ethereum funds.
Quick overview
- $109.5 million has flowed into Ethereum funds over the last 12 trading days, with BlackRock's iShares Ethereum Trust leading the way.
- BlackRock is seeking SEC approval to add staking rewards to its Ether ETFs, which could significantly enhance inflows if approved.
- Ethereum's price is showing bullish momentum, with a potential breakout above $2,690 on the horizon.
- Recent technical indicators suggest a strong upward trend for ETH/USD, supported by a bullish MACD crossover.
Ethereum ETFs are on fire—literally. Over the last 12 trading days, institutional investors have put in $109.5 million into Ethereum funds. The clear winner? BlackRock’s iShares Ethereum Trust (ETHA) with $77.2 million. Fidelity’s FETH came in second with $21 million and Grayscale’s mini-Ether ETF with $8.4 million, according to Farside Investors.
The inflows come as a quiet rotation out of Bitcoin ETFs, including BlackRock’s IBIT. With Ethereum outperforming Bitcoin since mid-April, the capital shift says it all. ETHA’s price has gone up 45% in the last 30 days and is still down 25% year-to-date. The fund now has $3.7 billion in assets and holds over 1.4 million ETH.
Staking Rewards Could Be the Next Leg
BlackRock is also seeking SEC approval to add staking rewards to its Ether ETFs. If approved by Q3 2025 this would make ETHA the first ETF to offer direct exposure to staking yields—adding passive income for institutional investors.
But that’s not a done deal. The SEC has expressed concerns around securities classification and custody risks. Still if staking is approved it could change the game for ETFs in the proof-of-stake (PoS) era—and supercharge inflows.
ETH/USD Technicals: Bulls Back in Town
Beyond ETF flows, Ethereum’s price action is getting attention. ETH/USD is at $2,642, bouncing off the higher low at $2,579. The 4-hour chart shows a clean ascending trendline since mid-May and the 50-period EMA at $2,580 is a bullish confluence.
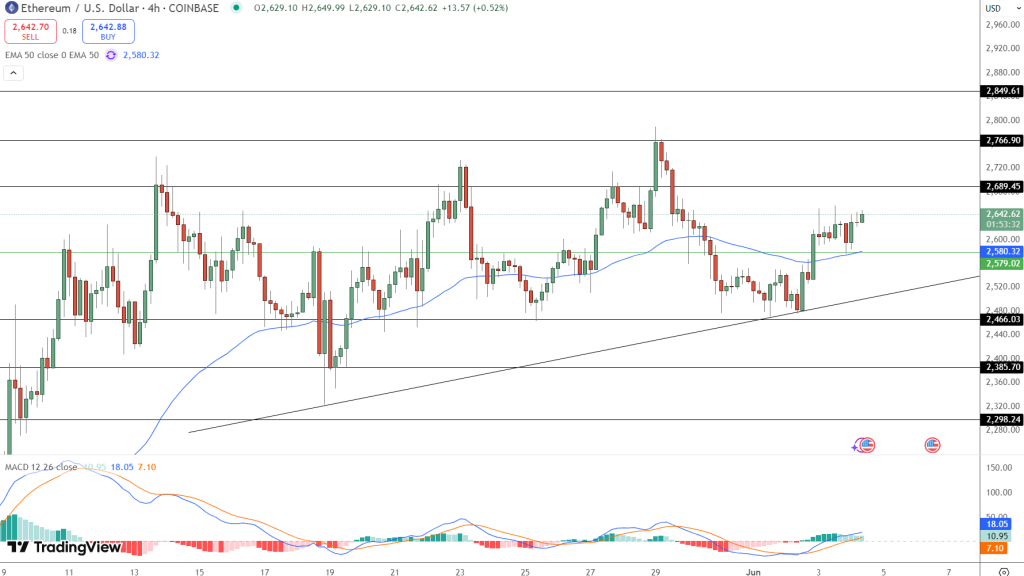
A bullish MACD crossover just happened and price is testing the horizontal resistance at $2,689. If ETH can close above $2,690 it may target the next resistances at $2,766 and $2,849. Multiple bullish engulfing candles have formed near support and the overall shape is a textbook ascending triangle—a pattern that often precedes breakouts.
Trade Setup (For Reference):
- Entry: Above $2,690 on confirmation
- Stop-Loss: $2,575
- Targets: $2,766 (TP1), $2,849 (TP2)
- Quick Points:
$109.5M into Ethereum funds over 12 days; ETHA wins.
- BlackRock seeking staking approval by Q3.
- Whale OTC activity at $516M.
- ETH/USD breakout above $2,690.
- Check out our free forex signals
- Follow the top economic events on FX Leaders economic calendar
- Trade better, discover more Forex Trading Strategies
- Open a FREE Trading Account
- Read our latest reviews on: Avatrade, Exness, HFM and XM
Related Articles
Sidebar rates
