Bitcoin Teeters at $108K as Supply Drought Sets Stage for Explosive Move
Bitcoin continues to trade around the $108,000 level, displaying remarkable resilience despite mixed technical signals and divergent
Quick overview
- Bitcoin is currently trading around $108,000, showing resilience amid mixed technical signals and analyst predictions.
- Exchange reserves of Bitcoin have hit critical lows, with a 14% drop in liquid supply since the start of 2025, indicating increased accumulation.
- Technical analysis suggests a bullish continuation towards $115,000, but recent price movements raise concerns about potential downtrends.
- The macroeconomic environment presents mixed signals, with low inflation data and geopolitical developments influencing Bitcoin's market dynamics.
Bitcoin BTC/USD continues to trade around the $108,000 level, displaying remarkable resilience despite mixed technical signals and divergent analyst predictions. While the cryptocurrency appears to be consolidating after recent gains, underlying market dynamics suggest a potential setup for significant volatility ahead.
BTC Exchange Reserves Hit Critical Lows as Accumulation Accelerates
The most interesting story coming out of the current market data is about how quickly Bitcoin’s liquid supply is running out. Since the start of 2025, the amount of Bitcoin owned by exchanges has dropped by 14%, reaching just 2.5 million BTC. This is the lowest level since August 2022. This means that there is a lot less supply available for instant trading.
The movement goes beyond regular exchanges to over-the-counter (OTC) desks, which help big institutions make trades. According to CryptoQuant statistics, OTC accounts linked to miners have lost 19% of their balances since January and now possess only 134,252 BTC. The fact that both retail and institutional trading platforms are squeezing the supply makes it possible for even small increases in demand to cause big price changes.
This pattern of supply usually means that investors are becoming more confident and are accumulating coins for the long term. Instead of staying on exchanges for active trading, coins are being put into cold storage.
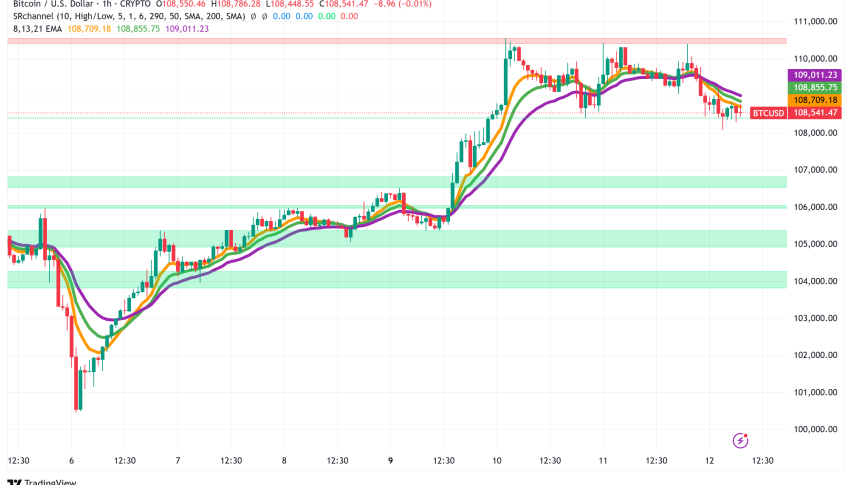
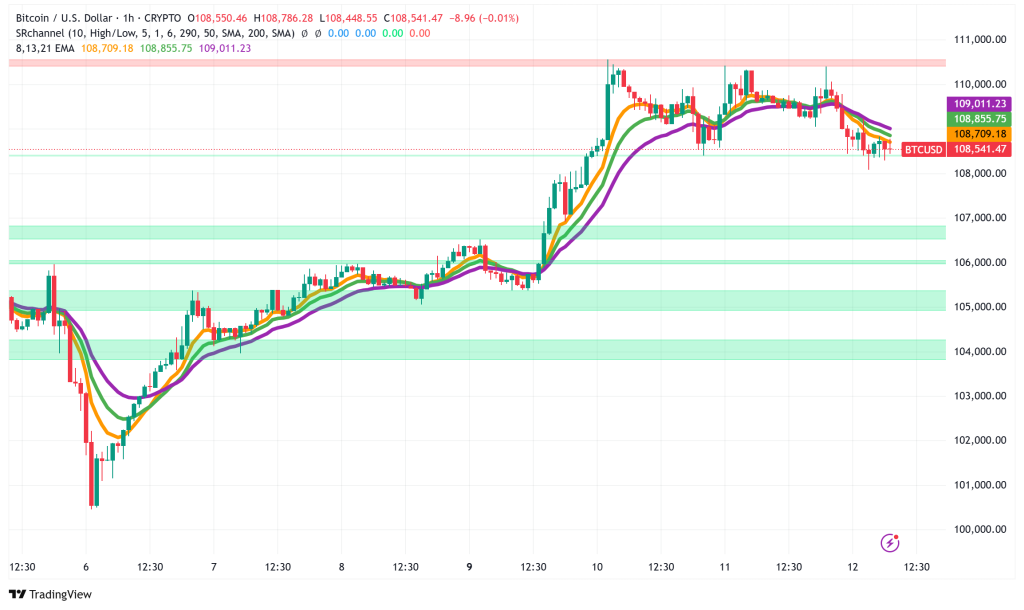
BTC/USD Technical Analysis: Bullish Continuation Despite Recent Pullback
From a technical point of view, Bitcoin looks mixed but mostly good. The cryptocurrency has made a bullish pennant pattern on shorter time periods, and the measured move shows a target of $115,000. This fits with other data that shows Bitcoin investors are feeling more positive than they have in seven months.
But the most recent price movement is showing some worrying indicators. Bitcoin couldn’t keep its momentum above $110,000 and has fallen below a positive trend line with support at $109,450. On daily charts, the 9-period exponential moving average has crossed below the 21-period EMA. This is a sign that has historically marked the start of big downtrends.
As of now, technical levels imply that $110,000 is a strong resistance level and $107,350 is a strong support level. If the price breaks above $110,500, it might start a rebound toward $115,000. If it doesn’t go back above $108,000, it could mean that the price is going to go down much further.
Macro Environment Provides Mixed Signals
The larger macroeconomic picture has both chances and dangers for Bitcoin. Recent US inflation data was lower than expected, with the CPI rising 2.4% from a year ago instead of the expected 2.5%. This dovish news first sent Bitcoin beyond $110,000 and the US Dollar Index down to its lowest level in months.
Also, President Trump’s announcement of a trade deal between the US and China has eased tensions between the two countries, but traditional markets didn’t react much to the news. The cryptocurrency market’s small divergence from traditional assets during this period shows that more institutions are using it and that it is less linked to older markets.
Still, expectations for a rate decrease by the Federal Reserve are low. Futures markets say there is a 73% chance that rates will stay at 3.75% or higher by December 2025, up from 42.5% just a month ago.
Contrarian Warning Signals Emerging
Peter Brandt, a seasoned trader, has given a strong warning that Bitcoin might drop by 75%, bringing prices down to about $27,290. This is despite the positive technical setup and supply dynamics. Brandt compares this to the market cycle of 2022, when Bitcoin hit its highest point twice before entering a long bad market.
Current derivatives data shows mixed feelings. The long/short ratios on key exchanges are slightly in favor of short positions, at about 0.55. In the past week, Bitcoin-focused financial products have lost $57 million, which is less than 0.2% of all assets under management.
Bitcoin Price Prediction and Outlook
Because of all the things that are happening, Bitcoin seems ready to make a big move in the next several weeks. The bullish case is based on the historical supply squeeze, good mood measures, and good macroeconomic news. If Bitcoin can go back above $110,000, technical targets say that a surge to $115,000 is still possible.
But the bearish scenario can’t be ruled out, especially as momentum hasn’t been able to stay above major resistance levels and there are some troubling technical divergences. If the price drops below $105,500, selling pressure could grow.
- Check out our free forex signals
- Follow the top economic events on FX Leaders economic calendar
- Trade better, discover more Forex Trading Strategies
- Open a FREE Trading Account
- Read our latest reviews on: Avatrade, Exness, HFM and XM
Related Articles


Sidebar rates
Related Posts
