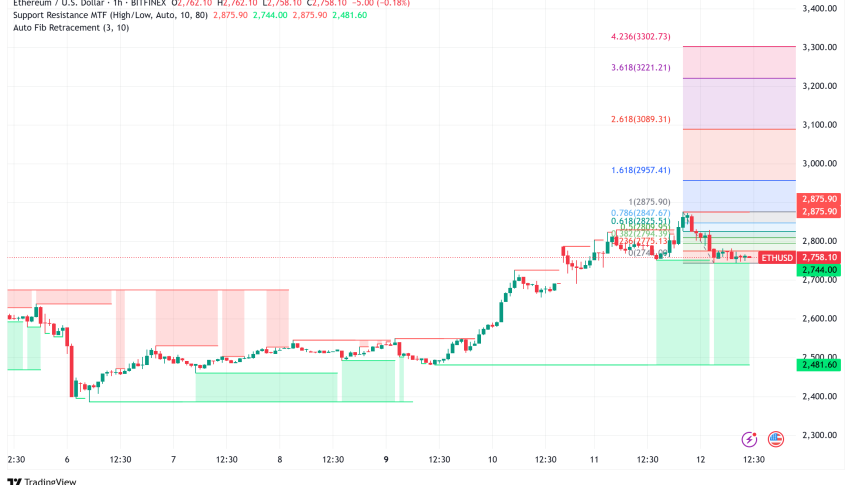
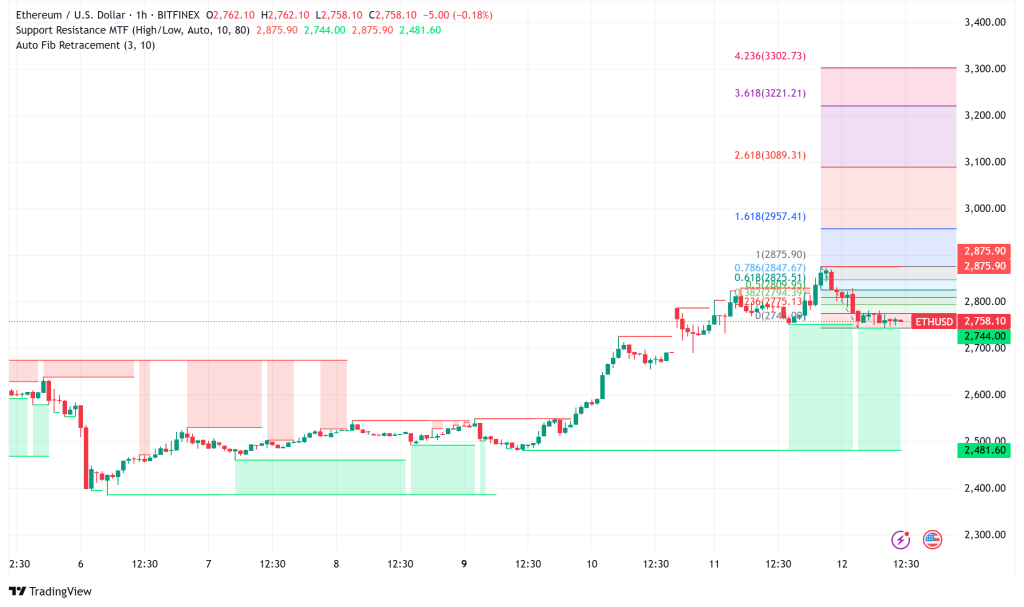
Ethereum Tests Critical $2,850 Resistance: Bulls Eye Breakout Above Ascending Channel
Ethereum (ETH) is currently trading above $2,700, down over 1% in the past 24 hours, as the cryptocurrency approaches a critical technical
Quick overview
- Ethereum is currently trading above $2,700, down over 1% in the past 24 hours, as it approaches a critical technical juncture.
- Technical analysts note that ETH is trapped in an ascending channel and needs to break above key resistance levels for significant upward movement.
- Institutional interest in Ethereum is surging, with record open interest in futures and strong accumulation patterns indicating robust demand.
- Key resistance levels to watch include $2,800 and $2,880, while important support levels are around $2,654 and $2,680.
Ethereum ETH/USD is currently trading above $2,700, down over 1% in the past 24 hours, as the cryptocurrency approaches a critical technical juncture that could determine its next major directional move. After briefly pushing past $2,850 earlier this week, the first time since February 4, ETH now faces a decisive test at key resistance levels that analysts believe will shape the broader altcoin market’s trajectory.
ETH/USD Technical Structure Points to Breakout Potential
Technical analysts are intently watching Ethereum’s price activity since it has created an ascending channel pattern that could break out. M-log1, a well-known analyst, says that ETH is still “trapped in an ascending channel” and has to break above this structure in a big way for any big upward movement to happen. When the cryptocurrency rose above $2,880, it temporarily tested the top limit of this channel. Since then, it has fallen back to its current position.
The recent move above the 200-day Simple Moving Average (SMA) at $2,654.52 is a big technical milestone because this level has traditionally been a good indicator of the medium-term trend direction. ETH is above all of the main moving averages, such as the 50-day ($2,333.32) and 100-day ($2,085.42) SMAs. This shows that bullish momentum is rising and the trend structure is getting stronger.
Record Institutional Interest Drives Market Dynamics
A big increase in institutional leverage is helping Ethereum’s current climb a lot. Futures open interest has hit an all-time high of 15.21 million ETH, with most of the surge coming from the Chicago Mercantile Exchange (CME). The Volatility Shares 2x leveraged ETH ETF (ETHU) has been the main driver, with institutional investors looking for more ways to have leveraged exposure to Ethereum.
From April 8 to June 9, ETHU’s ETH equivalent exposure went up by 305,100 ETH, and CME’s ETH open interest went up by 295,250 ETH. This concentration of institutional leverage is good for the market in the short term, but it has generated concerns about market stability if sentiment changes.
US spot Ethereum ETFs have kept up their purchasing push, bringing up a net of $124.93 million and extending their winning streak to 17 days in a row. This steady demand from institutions is a good sign that prices could go up.
Accumulation Patterns Signal Strong Underlying Demand
On-chain data shows a lot of accumulation activity. Accumulation addresses, which are addresses that have never sold or given away tokens, have seen substantial inflows of over 400,000 ETH in five of the last seven days. This pattern shows that long-term holders and fresh market participants are very sure of themselves.
The cryptocurrency has also gone above the cost basis of almost 2.1 million ETH that were bought for between $2,700 and $2,760, which is a big technical step forward. Glassnode says that if ETH can stay in the $2,700 to $2,760 region, “the path to $3,420 remains technically open.” However, the speed of any increase will depend on how holders act in the $2,800 to $3,300 range.
Ethereum Price Prediction: Key Levels to Watch
Different analytical frameworks show that Ethereum has similar upside targets. Elliott Wave research says that the cryptocurrency could go up to $5,000 to $6,000 or more if it stays above the current low of $2,385. The way things are set up right now suggests that ETH is in the early stages of a big third wave advance.
It’s easy to see where the near-term resistance levels are: $2,800 is the first level of resistance, followed by $2,840 and the recent high of $2,880. If the price breaks above $2,880, it might go up to $2,920 and then to the critical psychological milestone of $3,000. The next big technical goal is the 61.8% Fibonacci retracement at $3,078.
The 200-day SMA around $2,654, the $2,680 zone, and the 50% Fibonacci retracement level are all important support levels that could cause the price to go down. If the price drops below $2,680, it might test $2,620 and maybe even $2,550 again. However, this would probably be seen as a healthy correction in the overall upward trend.
- Check out our free forex signals
- Follow the top economic events on FX Leaders economic calendar
- Trade better, discover more Forex Trading Strategies
- Open a FREE Trading Account
- Read our latest reviews on: Avatrade, Exness, HFM and XM
Related Articles


Sidebar rates
Related Posts
